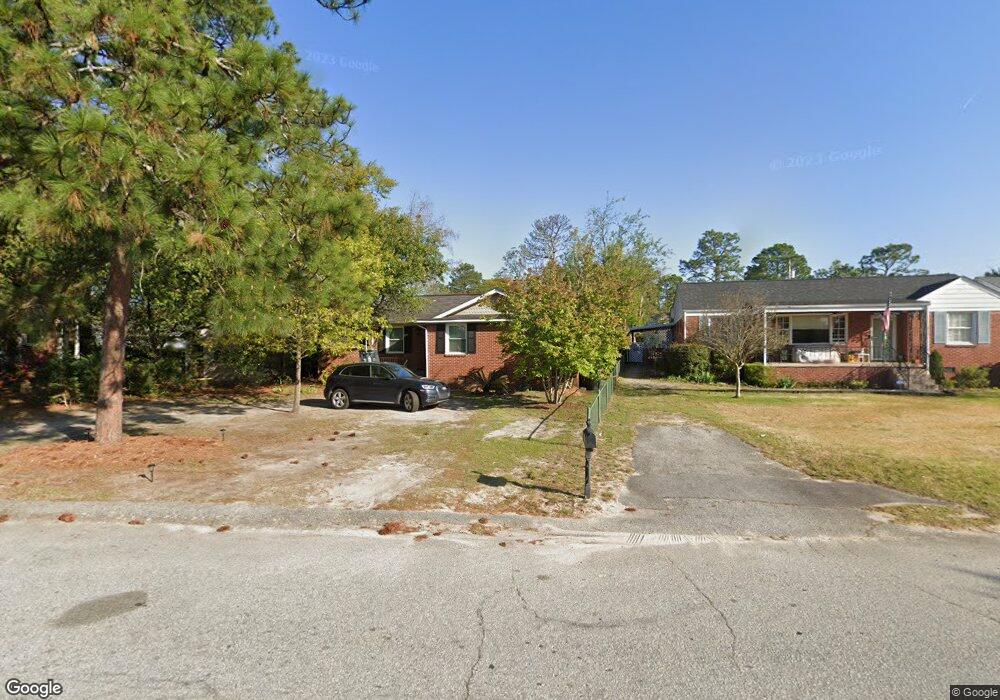
1438 D Ave West Columbia, SC 29169
Estimated Value: $197,000 - $235,650
3
Beds
1
Bath
1,376
Sq Ft
$155/Sq Ft
Est. Value
About This Home
This home is located at 1438 D Ave, West Columbia, SC 29169 and is currently estimated at $212,913, approximately $154 per square foot. 1438 D Ave is a home located in Lexington County with nearby schools including Riverbank Elementary, Cyril B. Busbee Creative Arts Academy, and Brookland-Cayce High School.
Ownership History
Date
Name
Owned For
Owner Type
Purchase Details
Closed on
Dec 6, 2022
Sold by
Wandover Richard G
Bought by
Kornemann Alexandria Elizabeth
Current Estimated Value
Home Financials for this Owner
Home Financials are based on the most recent Mortgage that was taken out on this home.
Original Mortgage
$182,631
Outstanding Balance
$176,921
Interest Rate
7.08%
Mortgage Type
FHA
Estimated Equity
$35,992
Purchase Details
Closed on
Nov 6, 2001
Sold by
Jordan Roddy M
Bought by
Wandover Richard G
Create a Home Valuation Report for This Property
The Home Valuation Report is an in-depth analysis detailing your home's value as well as a comparison with similar homes in the area
Home Values in the Area
Average Home Value in this Area
Purchase History
| Date | Buyer | Sale Price | Title Company |
|---|---|---|---|
| Kornemann Alexandria Elizabeth | $186,000 | -- | |
| Wandover Richard G | $85,000 | -- |
Source: Public Records
Mortgage History
| Date | Status | Borrower | Loan Amount |
|---|---|---|---|
| Open | Kornemann Alexandria Elizabeth | $182,631 |
Source: Public Records
Tax History Compared to Growth
Tax History
| Year | Tax Paid | Tax Assessment Tax Assessment Total Assessment is a certain percentage of the fair market value that is determined by local assessors to be the total taxable value of land and additions on the property. | Land | Improvement |
|---|---|---|---|---|
| 2024 | $1,422 | $7,440 | $1,400 | $6,040 |
| 2023 | $1,422 | $4,304 | $1,400 | $2,904 |
| 2022 | $830 | $4,304 | $1,400 | $2,904 |
| 2020 | $797 | $4,304 | $1,400 | $2,904 |
| 2019 | $760 | $4,020 | $1,400 | $2,620 |
| 2018 | $768 | $4,020 | $1,400 | $2,620 |
| 2017 | $737 | $4,020 | $1,400 | $2,620 |
| 2016 | $758 | $4,019 | $1,400 | $2,619 |
| 2014 | $571 | $3,980 | $1,380 | $2,600 |
| 2013 | -- | $3,980 | $1,380 | $2,600 |
Source: Public Records
Map
Nearby Homes
- 1445 D Ave
- 1610 D Ave
- 1452 C Ave
- 1628 C Ave
- 224 17th St
- 1734 C Ave
- 1608 Crapps Ave
- Tract 1 Hallelujah Rd
- 1224 Evergreen Ave
- 324 N Parson St
- 1235 Jensen St
- 1802 D Ave
- 1310 Karlaney Ave
- 1011 D Ave
- 1301 Karlaney Ave
- 1028 Augusta St
- Oak Plan at Faith Hills
- 1246 Lafayette Ave
- 153 Cavendish Dr
- 151 Cavendish Dr