1438 Maple St Wyandotte, MI 48192
Estimated Value: $207,000 - $229,000
--
Bed
2
Baths
1,320
Sq Ft
$167/Sq Ft
Est. Value
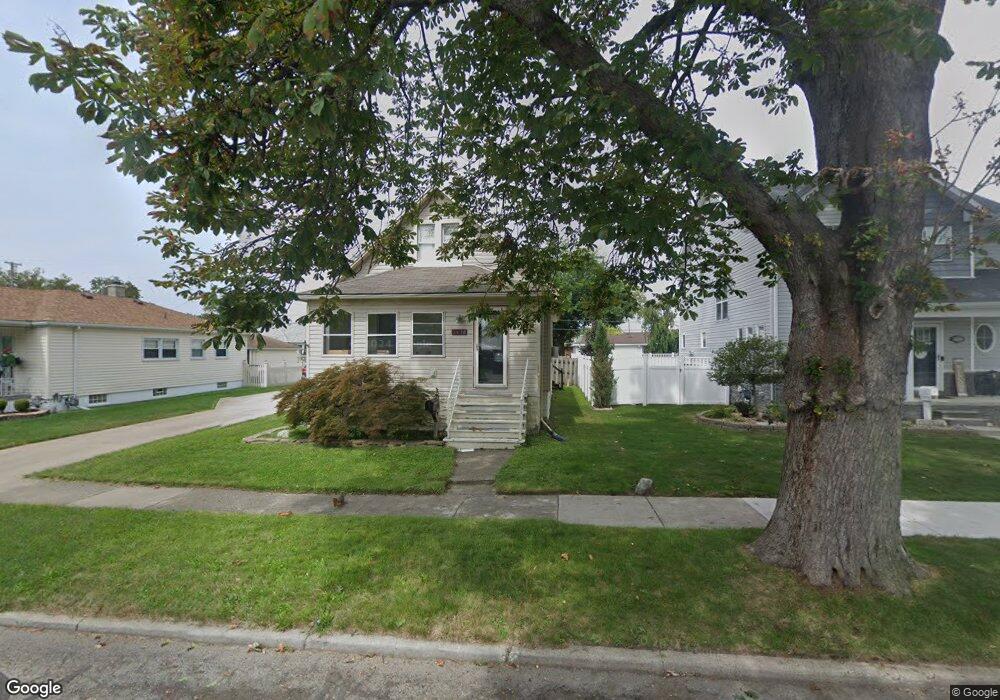
About This Home
This home is located at 1438 Maple St, Wyandotte, MI 48192 and is currently estimated at $220,593, approximately $167 per square foot. 1438 Maple St is a home located in Wayne County with nearby schools including Washington Elementary School, Woodrow Wilson School, and Roosevelt High School.
Ownership History
Date
Name
Owned For
Owner Type
Purchase Details
Closed on
Jun 5, 2012
Sold by
Stemen Justin and Stemen Victoria
Bought by
Stemen Justin and Miskell Amanda M
Current Estimated Value
Purchase Details
Closed on
Feb 11, 2009
Sold by
Amtrust Bank
Bought by
Hiuser Victoria
Purchase Details
Closed on
Nov 28, 2007
Sold by
Keene Audie S and Keene Mary Beth
Bought by
Am Trust Bank and Ohio Savings Bank
Purchase Details
Closed on
Jun 25, 2001
Sold by
Bates Audrey
Bought by
Keene Audie S
Purchase Details
Closed on
Jul 26, 1996
Sold by
Bates Gary T and Bates Richard W
Bought by
Angeline Domitrz and Angeline Domitz
Create a Home Valuation Report for This Property
The Home Valuation Report is an in-depth analysis detailing your home's value as well as a comparison with similar homes in the area
Home Values in the Area
Average Home Value in this Area
Purchase History
| Date | Buyer | Sale Price | Title Company |
|---|---|---|---|
| Stemen Justin | -- | None Available | |
| Hiuser Victoria | $42,000 | None Available | |
| Am Trust Bank | $145,000 | None Available | |
| Keene Audie S | $153,000 | -- | |
| Angeline Domitrz | $60,000 | -- |
Source: Public Records
Tax History Compared to Growth
Tax History
| Year | Tax Paid | Tax Assessment Tax Assessment Total Assessment is a certain percentage of the fair market value that is determined by local assessors to be the total taxable value of land and additions on the property. | Land | Improvement |
|---|---|---|---|---|
| 2025 | $2,263 | $102,500 | $0 | $0 |
| 2024 | $2,263 | $96,100 | $0 | $0 |
| 2023 | $2,158 | $86,800 | $0 | $0 |
| 2022 | $2,774 | $78,500 | $0 | $0 |
| 2021 | $2,710 | $73,700 | $0 | $0 |
| 2020 | $2,673 | $65,900 | $0 | $0 |
| 2019 | $2,632 | $62,000 | $0 | $0 |
| 2018 | $1,898 | $42,800 | $0 | $0 |
| 2017 | $1,318 | $42,800 | $0 | $0 |
| 2016 | $2,530 | $38,900 | $0 | $0 |
| 2015 | $3,406 | $36,100 | $0 | $0 |
| 2013 | $3,300 | $33,000 | $0 | $0 |
| 2012 | $1,914 | $34,000 | $9,400 | $24,600 |
Source: Public Records
Map
Nearby Homes