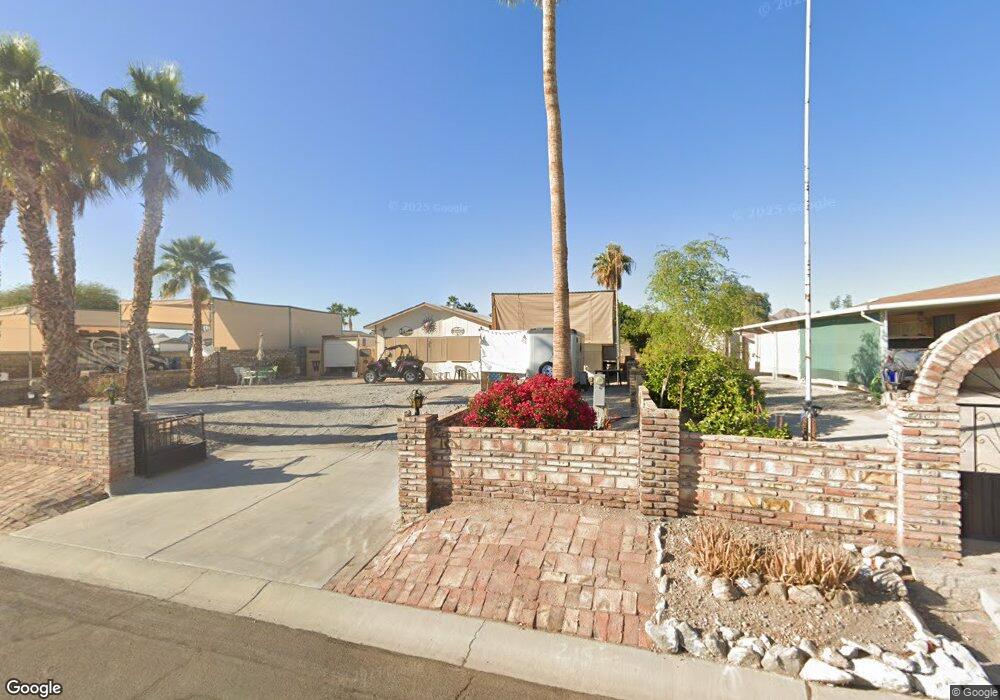
14398 E 31st Place Yuma, AZ 85367
Fortuna Foothills NeighborhoodEstimated Value: $139,000 - $217,000
--
Bed
1
Bath
600
Sq Ft
$283/Sq Ft
Est. Value
About This Home
This home is located at 14398 E 31st Place, Yuma, AZ 85367 and is currently estimated at $170,062, approximately $283 per square foot. 14398 E 31st Place is a home located in Yuma County with nearby schools including Sunrise Elementary School, Ron Watson Middle School, and Gila Ridge High School.
Ownership History
Date
Name
Owned For
Owner Type
Purchase Details
Closed on
Mar 23, 2016
Sold by
Minihane Neil and Minihane Bridge Sullivan
Bought by
Minihane Bridge Sullivan
Current Estimated Value
Purchase Details
Closed on
Mar 10, 2016
Sold by
Spicer Dale and Spicer Sarah Sullivan
Bought by
Spicer Sarah Sullivan
Purchase Details
Closed on
Jan 28, 2016
Sold by
Eassa Kevin and Eassa Theresa Sullivan
Bought by
Eassa Theresa Sullivan
Purchase Details
Closed on
Jan 21, 2016
Sold by
Sullivan Sean P
Bought by
Sullivan Sean P and Eassa Theresa Sullivan
Purchase Details
Closed on
Dec 10, 2015
Sold by
Bronson Heather J and Neal Sandra L
Bought by
Sullivan Sean P
Purchase Details
Closed on
Feb 22, 2010
Sold by
Quesada Martin R and Quesada Barbara E
Bought by
Bronson Heather J and Neal Sandra L
Purchase Details
Closed on
Jan 27, 2003
Sold by
Quesada Martin R and Quesada Barbara E
Bought by
Quesada Martin R and Quesada Barbara E
Create a Home Valuation Report for This Property
The Home Valuation Report is an in-depth analysis detailing your home's value as well as a comparison with similar homes in the area
Home Values in the Area
Average Home Value in this Area
Purchase History
| Date | Buyer | Sale Price | Title Company |
|---|---|---|---|
| Minihane Bridge Sullivan | -- | None Available | |
| Spicer Sarah Sullivan | -- | None Available | |
| Eassa Theresa Sullivan | -- | None Available | |
| Sullivan Sean P | -- | None Available | |
| Sullivan Sean P | $69,500 | Chicago Title Agency Inc | |
| Bronson Heather J | $118,000 | Chicago Title | |
| Quesada Martin R | -- | Citizens Title |
Source: Public Records
Tax History Compared to Growth
Tax History
| Year | Tax Paid | Tax Assessment Tax Assessment Total Assessment is a certain percentage of the fair market value that is determined by local assessors to be the total taxable value of land and additions on the property. | Land | Improvement |
|---|---|---|---|---|
| 2025 | $837 | $8,796 | $4,758 | $4,038 |
| 2024 | $828 | $8,378 | $4,363 | $4,015 |
| 2023 | $828 | $7,978 | $4,470 | $3,508 |
| 2022 | $799 | $7,598 | $4,175 | $3,423 |
| 2021 | $849 | $7,284 | $4,000 | $3,284 |
| 2020 | $815 | $7,293 | $4,000 | $3,293 |
| 2019 | $822 | $7,094 | $3,000 | $4,094 |
| 2018 | $917 | $7,847 | $3,810 | $4,037 |
| 2017 | $880 | $7,847 | $3,810 | $4,037 |
| 2016 | $952 | $7,511 | $4,708 | $2,803 |
| 2015 | $768 | $7,154 | $4,541 | $2,613 |
| 2014 | $768 | $6,813 | $3,550 | $3,263 |
Source: Public Records
Map
Nearby Homes
- 14459 E Fortuna Palms Place
- 14351 E Fortuna Palms Dr
- 14318 E 29th Place
- 14272 E Fortuna Palms Dr
- 0000 S Ave 14 -- E Unit 198-11-001
- 14405 E 28 Place
- 14438 E 28th Place
- 10779 S Avenue 14 E
- 13881 S Fortuna Palms Loop
- 14285 E 28th Ln
- 13883 E Fortuna Palms Dr
- 13896 E Fortuna Palms Loop
- 10850 S Fortuna Palms Loop
- 14552 E 28th St
- 14423 E Suzanne de Fortuna Dr
- 10317 Mountain Dr
- 10310 S Avenue 14 E
- Lot C-1 Gold Bar Dr
- Lot C-2 Gold Bar Dr
- 0002 S Masterson
- 14388 E 31st Place
- 14409 E Fortuna Palms Place
- 14378 E 31st Place
- 14418 E 31st Place
- 14419 E Fortuna Palms Place
- 14379 E Fortuna Palms Place
- 14368 E 31st Place
- 14391 E 31st Place
- 14429 E Fortuna Palms Place
- 14358 E 31 Place
- 14390 E Fortuna Palms Place
- 14410 E Fortuna Palms Place
- 14410 E Fortuna Palms Dr
- 14439 E Fortuna Palms Place
- 14359 E Fortuna Palms Place
- 14349 E Fortuna Palms Place
- 14380 E Fortuna Palms Place
- 14367 E 31st Place
- 14420 E Fortuna Palms Place
- 14379 E 31st Place