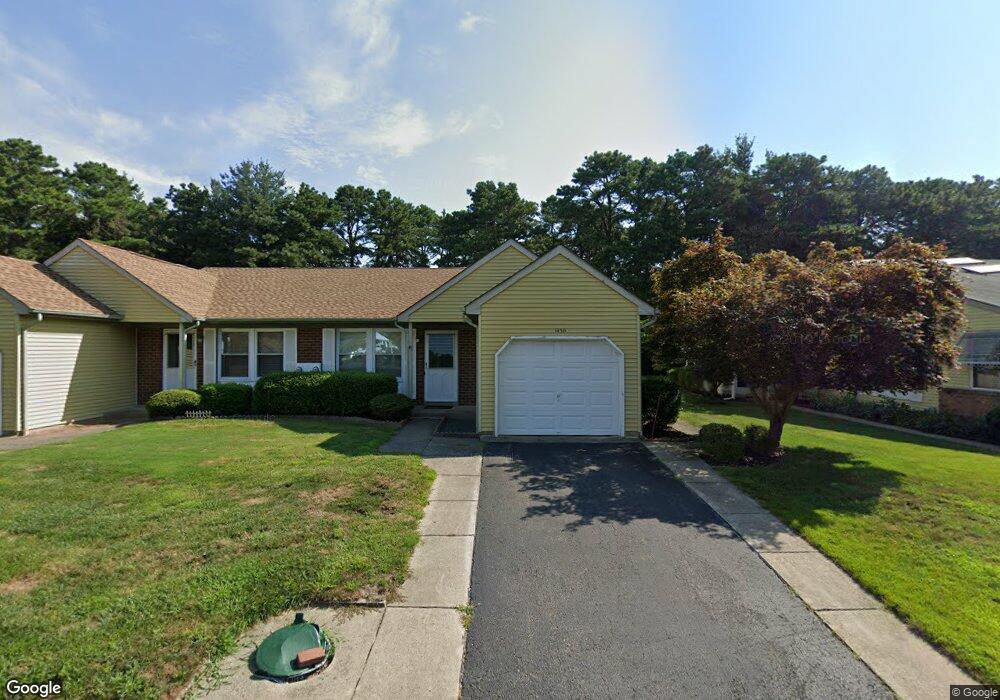
143B Sunset Rd Whiting, NJ 08759
Estimated Value: $201,000 - $227,000
2
Beds
2
Baths
1,184
Sq Ft
$180/Sq Ft
Est. Value
About This Home
This home is located at 143B Sunset Rd, Whiting, NJ 08759 and is currently estimated at $212,787, approximately $179 per square foot. 143B Sunset Rd is a home located in Ocean County with nearby schools including Manchester Township High School.
Ownership History
Date
Name
Owned For
Owner Type
Purchase Details
Closed on
Nov 20, 2020
Sold by
Boyle Doris and Boyle Stephen
Bought by
Davis Sharon M
Current Estimated Value
Home Financials for this Owner
Home Financials are based on the most recent Mortgage that was taken out on this home.
Original Mortgage
$90,000
Outstanding Balance
$80,087
Interest Rate
2.8%
Mortgage Type
New Conventional
Estimated Equity
$132,700
Purchase Details
Closed on
Oct 24, 2005
Sold by
Frasca Frank G and Frasca Carol
Bought by
Boyle Robert and Boyle Doris
Purchase Details
Closed on
Jul 20, 2004
Sold by
Maczko Helen and Mcdowell Harold
Bought by
Frasca Frank G
Home Financials for this Owner
Home Financials are based on the most recent Mortgage that was taken out on this home.
Original Mortgage
$105,600
Interest Rate
6.28%
Mortgage Type
Purchase Money Mortgage
Purchase Details
Closed on
Dec 9, 2002
Sold by
Palace William
Bought by
Maczko Helen and Mc Dowell Harold
Create a Home Valuation Report for This Property
The Home Valuation Report is an in-depth analysis detailing your home's value as well as a comparison with similar homes in the area
Home Values in the Area
Average Home Value in this Area
Purchase History
| Date | Buyer | Sale Price | Title Company |
|---|---|---|---|
| Davis Sharon M | $100,000 | Trident Abstract Ttl Agcy Ll | |
| Boyle Robert | $143,900 | Empire Title & Abstract Agen | |
| Frasca Frank G | $132,000 | -- | |
| Maczko Helen | $90,000 | -- |
Source: Public Records
Mortgage History
| Date | Status | Borrower | Loan Amount |
|---|---|---|---|
| Open | Davis Sharon M | $90,000 | |
| Previous Owner | Frasca Frank G | $105,600 | |
| Closed | Frasca Frank G | $19,800 |
Source: Public Records
Tax History
| Year | Tax Paid | Tax Assessment Tax Assessment Total Assessment is a certain percentage of the fair market value that is determined by local assessors to be the total taxable value of land and additions on the property. | Land | Improvement |
|---|---|---|---|---|
| 2025 | $2,141 | $209,900 | $49,000 | $160,900 |
| 2024 | $2,032 | $87,200 | $8,000 | $79,200 |
Source: Public Records
Map
Nearby Homes
- 153A Sunset Rd
- 40A Stonybrook Rd Unit 62
- 9A Greenwood Ln
- 6 Holyoke Ct
- 12B Golden Ct
- 7B Greenwood Ln Unit 62
- 15 Alpine Rd Unit 63
- 7 Amherst Rd Unit A
- 1B Greenwood Ln Unit B
- 27 Amesbury Rd
- 27 Amesbury Rd Unit 64
- 9A Ardsley Ave Unit 64
- 33 Medford Rd Unit A
- 3B Alpine Rd Unit 63
- 3B Alpine Rd Unit B
- 10 Alpine Rd Unit 63
- 8 Alpine Rd Unit C
- 69D Sunset Rd Unit 60
- 4 Ardsley Ave Unit 63
- 19 Dartmouth St
- 143B Sunset Rd Unit B
- 143A Sunset Rd
- 143A Sunset Rd Unit 60
- 145A Sunset Rd
- 141B Sunset Rd
- 145B Sunset Rd
- 141 Sunset Rd Unit 60
- 141 Sunset Rd Unit A
- 141 Sunset Rd
- 141A Sunset Rd
- 141A Sunset Rd Unit A
- 147A Sunset Rd
- 147A Sunset Rd Unit B
- 134B Sunset Rd
- 134A Sunset Rd
- 132A Sunset Rd
- 132A Sunset Rd Unit A
- 139B Sunset Rd
- 139B Sunset Rd Unit B
- 139B Sunset Rd Unit 60
Your Personal Tour Guide
Ask me questions while you tour the home.