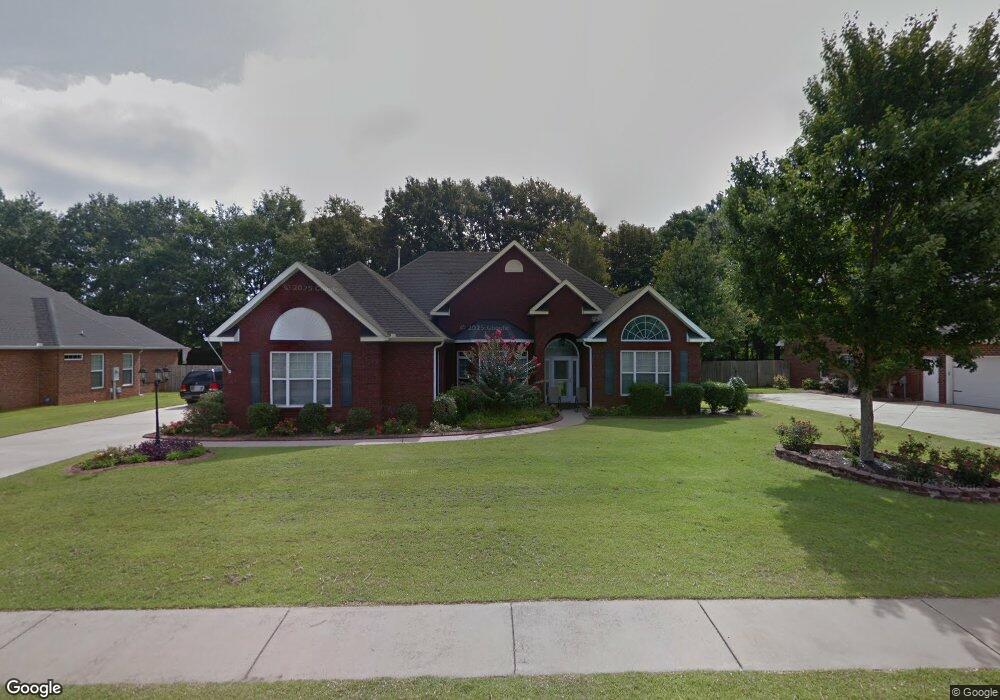
144 Abercorn St Warner Robins, GA 31088
Estimated Value: $389,621 - $467,000
4
Beds
3
Baths
2,640
Sq Ft
$161/Sq Ft
Est. Value
About This Home
This home is located at 144 Abercorn St, Warner Robins, GA 31088 and is currently estimated at $424,405, approximately $160 per square foot. 144 Abercorn St is a home located in Houston County with nearby schools including David A. Perdue Primary School, David A. Perdue Elementary School, and Feagin Mill Middle School.
Ownership History
Date
Name
Owned For
Owner Type
Purchase Details
Closed on
Jul 1, 2019
Sold by
Nguyen Jason V and Than Khuyen L
Bought by
Tran Khuyen Le
Current Estimated Value
Purchase Details
Closed on
Jan 28, 2019
Sold by
Tran Honey L
Bought by
Nguyen Jason V and Tran Khuyen L
Purchase Details
Closed on
Nov 25, 2018
Sold by
Tran Khuyen
Bought by
Nguyen Jason V and Tran Khuyen L
Purchase Details
Closed on
Aug 29, 2017
Sold by
Collins Joe R and Collins Barbara A
Bought by
Tran Honey L and Tran Khuyen L
Purchase Details
Closed on
Nov 29, 2005
Sold by
Dixie Delta Corporation
Bought by
Collins Joe R and Collins Barbara A
Create a Home Valuation Report for This Property
The Home Valuation Report is an in-depth analysis detailing your home's value as well as a comparison with similar homes in the area
Home Values in the Area
Average Home Value in this Area
Purchase History
| Date | Buyer | Sale Price | Title Company |
|---|---|---|---|
| Tran Khuyen Le | -- | None Available | |
| Nguyen Jason V | -- | None Available | |
| Nguyen Jason V | -- | None Available | |
| Tran Honey L | $257,500 | None Available | |
| Collins Joe R | $255,300 | -- |
Source: Public Records
Tax History Compared to Growth
Tax History
| Year | Tax Paid | Tax Assessment Tax Assessment Total Assessment is a certain percentage of the fair market value that is determined by local assessors to be the total taxable value of land and additions on the property. | Land | Improvement |
|---|---|---|---|---|
| 2024 | $3,507 | $146,600 | $16,000 | $130,600 |
| 2023 | $3,091 | $127,880 | $16,000 | $111,880 |
| 2022 | $2,908 | $120,320 | $16,000 | $104,320 |
| 2021 | $2,436 | $100,280 | $16,000 | $84,280 |
| 2020 | $2,395 | $98,120 | $16,000 | $82,120 |
| 2019 | $2,395 | $98,120 | $16,000 | $82,120 |
| 2018 | $2,395 | $98,120 | $16,000 | $82,120 |
| 2017 | $2,348 | $98,120 | $16,000 | $82,120 |
| 2016 | $2,352 | $98,120 | $16,000 | $82,120 |
| 2015 | $2,357 | $98,120 | $16,000 | $82,120 |
| 2014 | -- | $98,120 | $16,000 | $82,120 |
| 2013 | -- | $98,120 | $16,000 | $82,120 |
Source: Public Records
Map
Nearby Homes
- 142 Abercorn St
- 146 Abercorn St
- 207 Twelve Oaks Dr
- 205 Twelve Oaks Dr
- 316 Montgomery St
- 140 Abercorn St
- 148 Abercorn St
- 202 Kady Lynn Way
- 205 Kady Lynn Way
- 203 Kady Lynn Way
- 200 Kady Lynn Way
- 201 Kady Lynn Way Unit 1W
- 201 Kady Lynn Way
- 204 Kady Lynn Way
- 209 Twelve Oaks Dr
- 219 Broughton St
- 203 Twelve Oaks Dr
- 315 Montgomery St
- 138 Abercorn St
- 211 Twelve Oaks Dr