144 Chapin St Southbridge, MA 01550
Estimated Value: $390,000 - $448,000
6
Beds
3
Baths
3,272
Sq Ft
$129/Sq Ft
Est. Value
About This Home
This home is located at 144 Chapin St, Southbridge, MA 01550 and is currently estimated at $421,612, approximately $128 per square foot. 144 Chapin St is a home located in Worcester County with nearby schools including Trinity Catholic Academy and ViewPoint Christian Academy.
Ownership History
Date
Name
Owned For
Owner Type
Purchase Details
Closed on
Jul 20, 2006
Sold by
Peloquin Sylvia A and Snow Sylvia A
Bought by
Schleyer Reed Warren and Schleyer Rosita Torres
Current Estimated Value
Home Financials for this Owner
Home Financials are based on the most recent Mortgage that was taken out on this home.
Original Mortgage
$222,000
Interest Rate
6.67%
Mortgage Type
Purchase Money Mortgage
Purchase Details
Closed on
Aug 22, 2003
Sold by
Bouvier Paul F
Bought by
Peloquin Sylvia A
Purchase Details
Closed on
Nov 13, 1998
Sold by
Bouvier Albert E Est and Bouvier William F
Bought by
Bouvier Paul F and Bouvier Dale Rennell
Create a Home Valuation Report for This Property
The Home Valuation Report is an in-depth analysis detailing your home's value as well as a comparison with similar homes in the area
Home Values in the Area
Average Home Value in this Area
Purchase History
| Date | Buyer | Sale Price | Title Company |
|---|---|---|---|
| Schleyer Reed Warren | $277,500 | -- | |
| Schleyer Reed Warren | $277,500 | -- | |
| Peloquin Sylvia A | -- | -- | |
| Peloquin Sylvia A | -- | -- | |
| Bouvier Paul F | $90,000 | -- | |
| Bouvier Paul F | $90,000 | -- |
Source: Public Records
Mortgage History
| Date | Status | Borrower | Loan Amount |
|---|---|---|---|
| Open | Bouvier Paul F | $214,000 | |
| Closed | Schleyer Reed Warren | $222,000 |
Source: Public Records
Tax History Compared to Growth
Tax History
| Year | Tax Paid | Tax Assessment Tax Assessment Total Assessment is a certain percentage of the fair market value that is determined by local assessors to be the total taxable value of land and additions on the property. | Land | Improvement |
|---|---|---|---|---|
| 2025 | $5,754 | $392,500 | $41,000 | $351,500 |
| 2024 | $6,069 | $397,700 | $34,100 | $363,600 |
| 2023 | $5,709 | $360,400 | $34,100 | $326,300 |
| 2022 | $5,381 | $300,600 | $29,200 | $271,400 |
| 2021 | $5,159 | $265,400 | $29,200 | $236,200 |
| 2020 | $4,658 | $239,100 | $29,200 | $209,900 |
| 2018 | $4,414 | $212,700 | $29,200 | $183,500 |
| 2017 | $4,040 | $196,400 | $29,200 | $167,200 |
| 2016 | $4,054 | $200,600 | $29,200 | $171,400 |
| 2015 | $4,424 | $217,300 | $29,200 | $188,100 |
| 2014 | $4,560 | $232,200 | $29,200 | $203,000 |
Source: Public Records
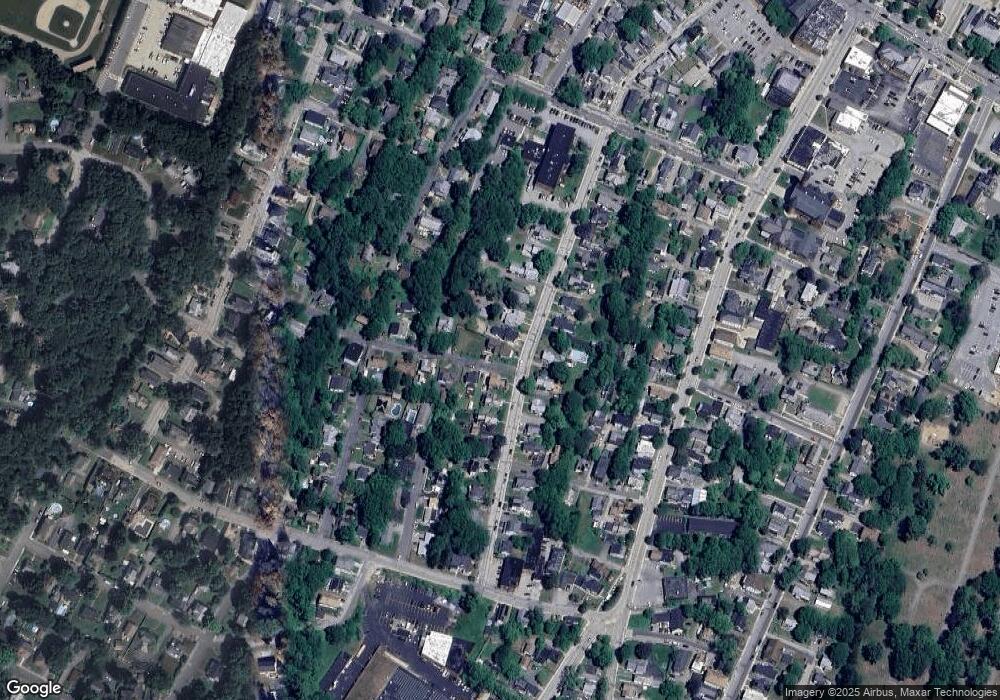
Map
Nearby Homes