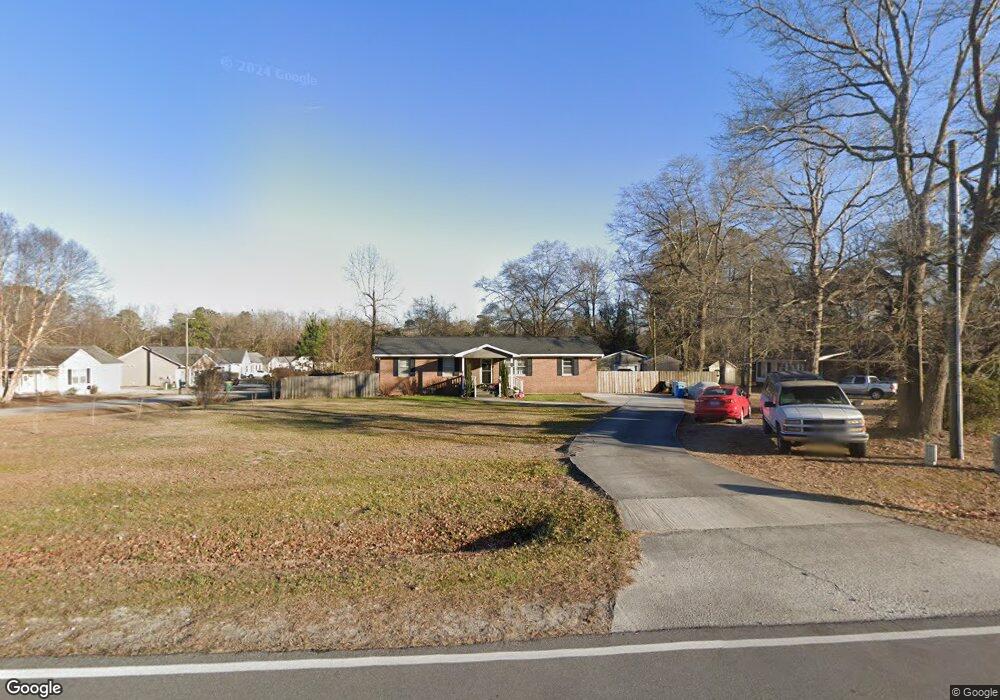
144 Core Rd Richlands, NC 28574
Estimated Value: $209,000 - $239,721
3
Beds
2
Baths
1,350
Sq Ft
$168/Sq Ft
Est. Value
About This Home
This home is located at 144 Core Rd, Richlands, NC 28574 and is currently estimated at $227,430, approximately $168 per square foot. 144 Core Rd is a home located in Onslow County with nearby schools including Richlands Elementary School, Trexler Middle School, and Richlands High School.
Ownership History
Date
Name
Owned For
Owner Type
Purchase Details
Closed on
Aug 3, 2020
Sold by
Hunt Matthew C and Hunt Misty
Bought by
Hale Jonah and Hale Caylei
Current Estimated Value
Home Financials for this Owner
Home Financials are based on the most recent Mortgage that was taken out on this home.
Original Mortgage
$126,852
Outstanding Balance
$112,734
Interest Rate
3.1%
Mortgage Type
VA
Estimated Equity
$114,696
Purchase Details
Closed on
Mar 27, 2008
Sold by
Stoddard Robert R and Stoddard Deborah A
Bought by
Hunt Matthew C and Hunt Crystal R
Home Financials for this Owner
Home Financials are based on the most recent Mortgage that was taken out on this home.
Original Mortgage
$139,000
Interest Rate
6.03%
Mortgage Type
Purchase Money Mortgage
Purchase Details
Closed on
Apr 7, 2006
Sold by
Worrell Michael
Bought by
Stoddard Robert R and Stoddard Deborah A
Home Financials for this Owner
Home Financials are based on the most recent Mortgage that was taken out on this home.
Original Mortgage
$129,730
Interest Rate
6.23%
Mortgage Type
VA
Create a Home Valuation Report for This Property
The Home Valuation Report is an in-depth analysis detailing your home's value as well as a comparison with similar homes in the area
Home Values in the Area
Average Home Value in this Area
Purchase History
| Date | Buyer | Sale Price | Title Company |
|---|---|---|---|
| Hale Jonah | $124,000 | None Available | |
| Hunt Matthew C | $139,000 | None Available | |
| Stoddard Robert R | $127,000 | None Available |
Source: Public Records
Mortgage History
| Date | Status | Borrower | Loan Amount |
|---|---|---|---|
| Open | Hale Jonah | $126,852 | |
| Previous Owner | Hunt Matthew C | $139,000 | |
| Previous Owner | Stoddard Robert R | $129,730 |
Source: Public Records
Tax History
| Year | Tax Paid | Tax Assessment Tax Assessment Total Assessment is a certain percentage of the fair market value that is determined by local assessors to be the total taxable value of land and additions on the property. | Land | Improvement |
|---|---|---|---|---|
| 2025 | $758 | $115,699 | $27,860 | $87,839 |
| 2024 | $758 | $115,699 | $27,860 | $87,839 |
| 2023 | $758 | $115,699 | $27,860 | $87,839 |
| 2022 | $758 | $115,699 | $27,860 | $87,839 |
| 2021 | $688 | $97,570 | $20,430 | $77,140 |
| 2020 | $688 | $97,570 | $20,430 | $77,140 |
| 2019 | $670 | $95,040 | $20,430 | $74,610 |
| 2018 | $670 | $95,040 | $20,430 | $74,610 |
| 2017 | $697 | $103,290 | $23,220 | $80,070 |
| 2016 | $697 | $103,290 | $0 | $0 |
| 2015 | $697 | $103,290 | $0 | $0 |
| 2014 | $697 | $103,290 | $0 | $0 |
Source: Public Records
Map
Nearby Homes
- 121 Walnut Hills Dr
- 123 Walnut Hills Dr
- 105 Coral Ridge Rd
- 203 Reef Ln
- 382 Bannermans Mill Rd
- 402 Crestmont Ct
- 387 Bannermans Mill Rd
- 108 Marvin Glen Ct
- 220 Westfield Dr
- 113 Indian Cave
- 146 Saint Rd
- 144 Saint Rd
- 136 Braeburn Blvd
- 459 Fowler Manning Rd
- 135 Edgewater Ln
- 463 Fowler Manning Rd
- 465 Fowler Manning Rd
- 302 Scranton Ct
- 467 Fowler Manning Rd
- 469 Fowler Manning Rd
Your Personal Tour Guide
Ask me questions while you tour the home.