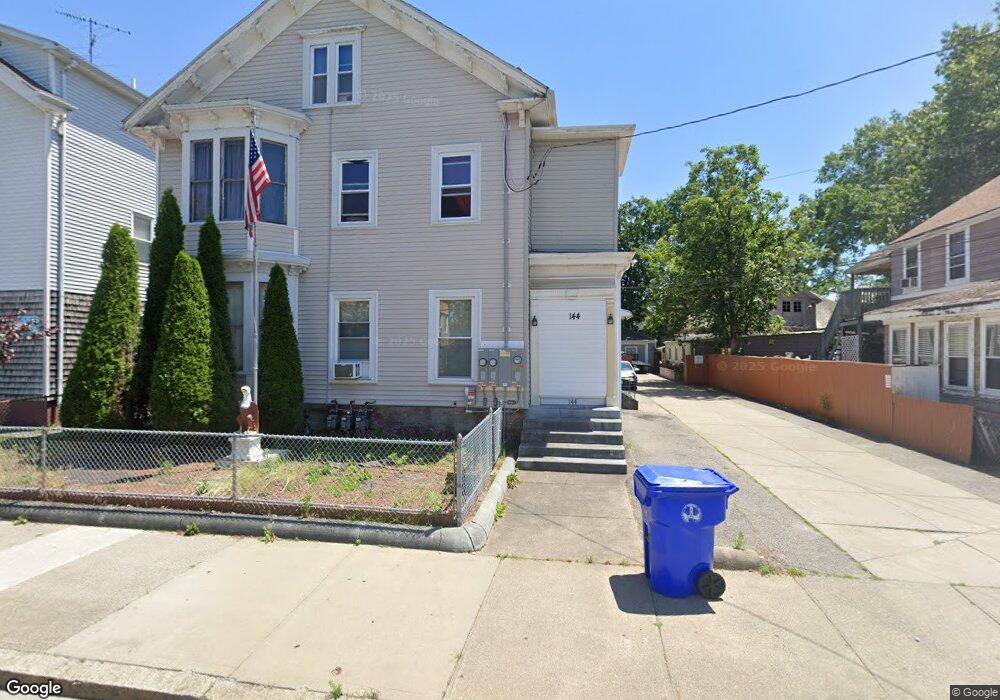
144 Cross St Central Falls, RI 02863
6
Beds
4
Baths
4,146
Sq Ft
8,712
Sq Ft Lot
About This Home
This home is located at 144 Cross St, Central Falls, RI 02863. 144 Cross St is a home located in Providence County with nearby schools including Central Falls Senior High School, Blackstone Valley Prep Junior High School, and Saint Raphael Academy.
Create a Home Valuation Report for This Property
The Home Valuation Report is an in-depth analysis detailing your home's value as well as a comparison with similar homes in the area
Home Values in the Area
Average Home Value in this Area
Tax History
| Year | Tax Paid | Tax Assessment Tax Assessment Total Assessment is a certain percentage of the fair market value that is determined by local assessors to be the total taxable value of land and additions on the property. | Land | Improvement |
|---|---|---|---|---|
| 2025 | $8,087 | $612,200 | $119,600 | $492,600 |
| 2024 | $7,426 | $394,800 | $85,100 | $309,700 |
| 2023 | $7,324 | $394,800 | $85,100 | $309,700 |
| 2022 | $4,738 | $394,800 | $85,100 | $309,700 |
| 2021 | $5,719 | $240,700 | $32,200 | $208,500 |
| 2020 | $5,702 | $240,700 | $32,200 | $208,500 |
| 2019 | $5,960 | $240,700 | $32,200 | $208,500 |
| 2018 | $4,959 | $188,500 | $31,100 | $157,400 |
| 2017 | $4,959 | $188,500 | $31,100 | $157,400 |
| 2016 | $4,888 | $188,500 | $31,100 | $157,400 |
| 2015 | $4,249 | $153,800 | $29,300 | $124,500 |
| 2014 | $4,193 | $153,800 | $29,300 | $124,500 |
| 2013 | $3,956 | $153,800 | $29,300 | $124,500 |
Source: Public Records
Map
Nearby Homes
- 234 Central St Unit 236
- 84 Barton St
- 78 Barton St
- 88 Barton St
- 35 Rand St
- 140 Dexter St
- 256 High St
- 517 High St
- 396 Roosevelt Ave
- 511 High St
- 108 Sumner Ave
- 7 Fales St
- 30 Foundry St Unit 6
- 722 Dexter St Unit 726
- 66 Perry St
- 28 Bayley St Unit 107
- 28 Bayley St Unit 301
- 152 Washington St
- 76 Sylvian St Unit 80
- 70 Lincoln Ave
Your Personal Tour Guide
Ask me questions while you tour the home.