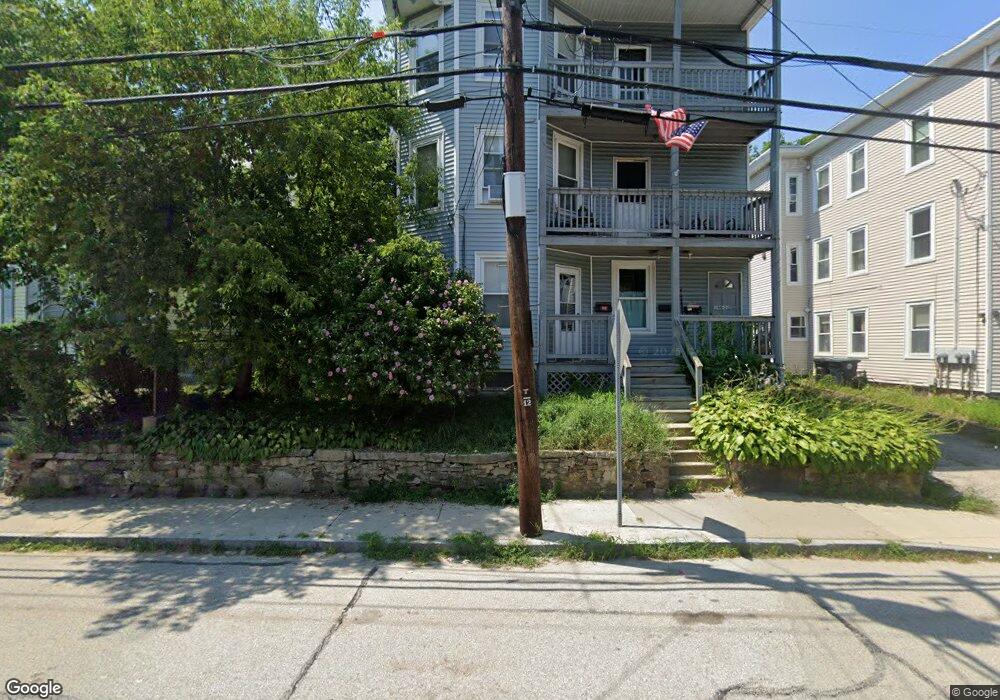
144 Elm St Southbridge, MA 01550
Estimated Value: $428,000 - $487,000
7
Beds
3
Baths
3,810
Sq Ft
$123/Sq Ft
Est. Value
About This Home
This home is located at 144 Elm St, Southbridge, MA 01550 and is currently estimated at $467,333, approximately $122 per square foot. 144 Elm St is a home located in Worcester County with nearby schools including Trinity Catholic Academy and ViewPoint Christian Academy.
Ownership History
Date
Name
Owned For
Owner Type
Purchase Details
Closed on
May 22, 1998
Sold by
Addington Michael A
Bought by
Fields John S
Current Estimated Value
Home Financials for this Owner
Home Financials are based on the most recent Mortgage that was taken out on this home.
Original Mortgage
$35,000
Outstanding Balance
$6,797
Interest Rate
7.03%
Mortgage Type
Purchase Money Mortgage
Estimated Equity
$460,536
Create a Home Valuation Report for This Property
The Home Valuation Report is an in-depth analysis detailing your home's value as well as a comparison with similar homes in the area
Home Values in the Area
Average Home Value in this Area
Purchase History
| Date | Buyer | Sale Price | Title Company |
|---|---|---|---|
| Fields John S | $67,000 | -- | |
| Fields John S | $67,000 | -- |
Source: Public Records
Mortgage History
| Date | Status | Borrower | Loan Amount |
|---|---|---|---|
| Open | Fields John S | $35,000 | |
| Closed | Fields John S | $35,000 |
Source: Public Records
Tax History Compared to Growth
Tax History
| Year | Tax Paid | Tax Assessment Tax Assessment Total Assessment is a certain percentage of the fair market value that is determined by local assessors to be the total taxable value of land and additions on the property. | Land | Improvement |
|---|---|---|---|---|
| 2025 | $5,402 | $368,500 | $31,600 | $336,900 |
| 2024 | $4,511 | $295,600 | $26,300 | $269,300 |
| 2023 | $4,209 | $265,700 | $26,300 | $239,400 |
| 2022 | $3,976 | $222,100 | $22,500 | $199,600 |
| 2021 | $3,979 | $204,700 | $22,500 | $182,200 |
| 2020 | $3,744 | $192,200 | $22,500 | $169,700 |
| 2018 | $2,849 | $137,300 | $20,000 | $117,300 |
| 2017 | $2,824 | $137,300 | $20,000 | $117,300 |
| 2016 | $2,573 | $127,300 | $20,000 | $107,300 |
| 2015 | $2,626 | $129,000 | $20,000 | $109,000 |
| 2014 | $2,534 | $129,000 | $20,000 | $109,000 |
Source: Public Records
Map
Nearby Homes
- 148 Elm St
- 138 Elm St
- 16 Williams St
- 134 Elm St
- 11 Crescent St
- 9 Crescent St
- 156 Elm St
- 156 Elm St Unit 2
- 128 & 128A Elm St
- 128 Elm St
- 128 Elm St Unit 2
- 128 Elm St
- 12 Crescent St
- 141 Elm St
- 20 Williams St
- 20 Williams St Unit 1
- 10 Crescent St
- 10 Crescent St Unit 1
- 10 Crescent St Unit 10
- 11 Williams St