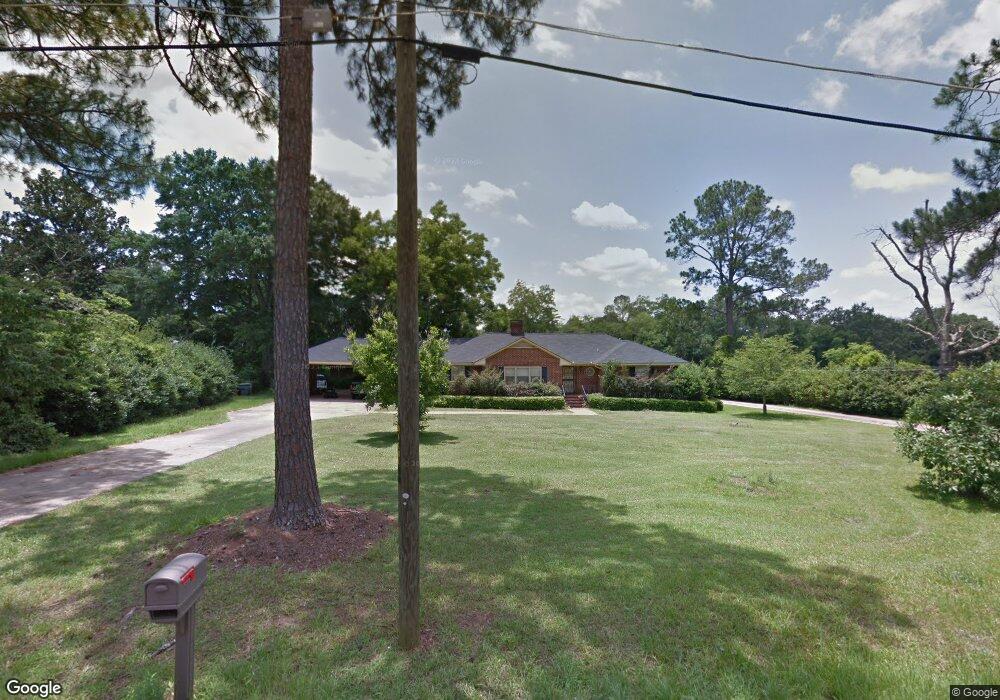
144 Keene St Cuthbert, GA 39840
Estimated Value: $161,572 - $229,000
3
Beds
2
Baths
1,911
Sq Ft
$101/Sq Ft
Est. Value
About This Home
This home is located at 144 Keene St, Cuthbert, GA 39840 and is currently estimated at $193,393, approximately $101 per square foot. 144 Keene St is a home located in Randolph County with nearby schools including Randolph County Elementary School, Randolph Clay Middle School, and Randolph Clay High School.
Ownership History
Date
Name
Owned For
Owner Type
Purchase Details
Closed on
Feb 27, 2017
Sold by
Garcia Christy
Bought by
Kelly Ronnie
Current Estimated Value
Home Financials for this Owner
Home Financials are based on the most recent Mortgage that was taken out on this home.
Original Mortgage
$119,759
Outstanding Balance
$99,144
Interest Rate
4.62%
Mortgage Type
FHA
Estimated Equity
$94,249
Purchase Details
Closed on
Nov 21, 2011
Sold by
Thompson Tessa B
Bought by
Garcia Christy
Home Financials for this Owner
Home Financials are based on the most recent Mortgage that was taken out on this home.
Original Mortgage
$117,500
Interest Rate
4.17%
Mortgage Type
Purchase Money Mortgage
Purchase Details
Closed on
Oct 30, 2006
Sold by
Hixon James Swann
Bought by
Thompson Tessa B
Create a Home Valuation Report for This Property
The Home Valuation Report is an in-depth analysis detailing your home's value as well as a comparison with similar homes in the area
Home Values in the Area
Average Home Value in this Area
Purchase History
We collect this data history from publicly available records. To have your information removed, we recommend requesting removal directly through your county’s website.
| Date | Buyer | Sale Price | Title Company |
|---|---|---|---|
| Kelly Ronnie | $122,000 | -- | |
| Kelly Ronnie | $122,000 | -- | |
| Garcia Christy | $117,500 | -- | |
| Garcia Christy | $117,500 | -- | |
| Thompson Tessa B | $107,000 | -- | |
| Thompson Tessa B | $107,000 | -- |
Source: Public Records
Mortgage History
We collect this data history from publicly available records. To have your information removed, we recommend requesting removal directly through your county’s website.
| Date | Status | Borrower | Loan Amount |
|---|---|---|---|
| Open | Kelly Ronnie | $119,759 | |
| Closed | Kelly Ronnie | $119,759 | |
| Previous Owner | Garcia Christy | $117,500 |
Source: Public Records
Tax History
| Year | Tax Paid | Tax Assessment Tax Assessment Total Assessment is a certain percentage of the fair market value that is determined by local assessors to be the total taxable value of land and additions on the property. | Land | Improvement |
|---|---|---|---|---|
| 2025 | $3,769 | $75,924 | $4,920 | $71,004 |
| 2024 | $3,485 | $68,528 | $4,440 | $64,088 |
| 2023 | $3,208 | $68,528 | $4,440 | $64,088 |
| 2022 | $2,506 | $68,528 | $4,440 | $64,088 |
| 2021 | $1,617 | $43,470 | $4,838 | $38,632 |
| 2020 | $1,663 | $43,470 | $4,838 | $38,632 |
| 2019 | $1,654 | $43,470 | $4,838 | $38,632 |
| 2018 | $2,002 | $43,470 | $4,838 | $38,632 |
| 2017 | $1,582 | $43,470 | $4,838 | $38,632 |
| 2016 | $1,587 | $43,471 | $4,838 | $38,632 |
| 2015 | -- | $43,471 | $4,838 | $38,632 |
| 2014 | -- | $41,351 | $4,838 | $36,513 |
| 2013 | -- | $41,351 | $4,838 | $36,512 |
Source: Public Records
Map
Nearby Homes
- 42 W Harris St
- 365 Highland Ave
- 140 College St
- 396 Hood St
- 147 Tote Rd
- 298 Nelson Coffin Dr
- 001 George Milling Rd
- 0077 George Milling Rd
- 005 George Milling Rd
- 04 George Milling Rd
- 012 George Milling Rd
- 008 George Milling Rd
- 013 George Milling Rd
- Old Spring Rd
- Cotton Hill Rd
- 0 Benevolence Hwy Unit 26314983
- 0 Pumpkin Creek Rd
- 73
- 3912 US Highway 82
- 3912 US Hwy 82
Your Personal Tour Guide
Ask me questions while you tour the home.