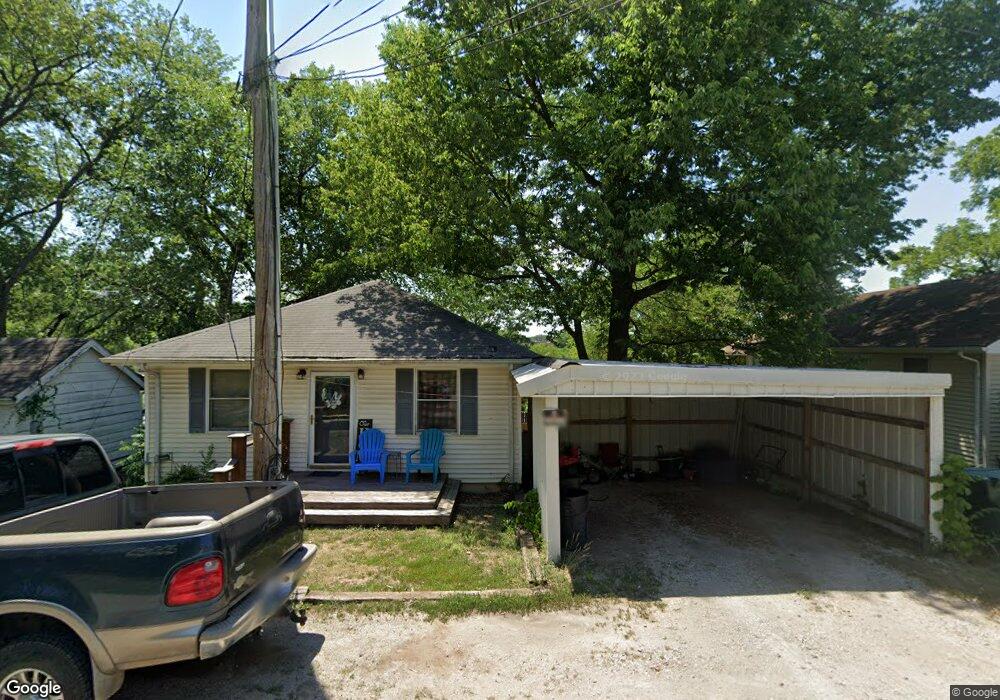
144 Libby St Osceola, MO 64776
Estimated Value: $129,000 - $168,000
4
Beds
2
Baths
1,700
Sq Ft
$89/Sq Ft
Est. Value
About This Home
This home is located at 144 Libby St, Osceola, MO 64776 and is currently estimated at $151,176, approximately $88 per square foot. 144 Libby St is a home located in St. Clair County with nearby schools including Osceola Elementary School and Osceola Junior/Senior High School.
Ownership History
Date
Name
Owned For
Owner Type
Purchase Details
Closed on
Nov 19, 2020
Sold by
Gregg James A
Bought by
Sommer David L and Sommer Joann G
Current Estimated Value
Home Financials for this Owner
Home Financials are based on the most recent Mortgage that was taken out on this home.
Original Mortgage
$60,000
Outstanding Balance
$53,391
Interest Rate
2.8%
Mortgage Type
Future Advance Clause Open End Mortgage
Estimated Equity
$97,785
Purchase Details
Closed on
Sep 11, 2015
Sold by
Gilliland Andrea Jameson and Gilliland Gerald
Bought by
Gregg James A
Home Financials for this Owner
Home Financials are based on the most recent Mortgage that was taken out on this home.
Original Mortgage
$49,500
Interest Rate
4.03%
Mortgage Type
Future Advance Clause Open End Mortgage
Purchase Details
Closed on
May 19, 2011
Sold by
Fields R G
Bought by
City Of Osceola
Create a Home Valuation Report for This Property
The Home Valuation Report is an in-depth analysis detailing your home's value as well as a comparison with similar homes in the area
Home Values in the Area
Average Home Value in this Area
Purchase History
| Date | Buyer | Sale Price | Title Company |
|---|---|---|---|
| Sommer David L | -- | None Available | |
| Gregg James A | -- | None Available | |
| City Of Osceola | -- | None Available |
Source: Public Records
Mortgage History
| Date | Status | Borrower | Loan Amount |
|---|---|---|---|
| Open | Sommer David L | $60,000 | |
| Previous Owner | Gregg James A | $49,500 |
Source: Public Records
Tax History Compared to Growth
Tax History
| Year | Tax Paid | Tax Assessment Tax Assessment Total Assessment is a certain percentage of the fair market value that is determined by local assessors to be the total taxable value of land and additions on the property. | Land | Improvement |
|---|---|---|---|---|
| 2024 | -- | $11,500 | $0 | $0 |
| 2023 | $0 | $11,500 | $0 | $0 |
| 2022 | $717 | $11,500 | $0 | $0 |
| 2021 | $716 | $11,500 | $0 | $0 |
| 2020 | $705 | $11,200 | $0 | $0 |
| 2019 | $702 | $11,200 | $0 | $0 |
| 2018 | $703 | $11,200 | $0 | $0 |
| 2017 | $736 | $11,200 | $0 | $0 |
| 2016 | $748 | $11,200 | $0 | $0 |
| 2015 | $745 | $11,200 | $0 | $0 |
| 2014 | -- | $11,400 | $0 | $0 |
| 2013 | -- | $11,400 | $0 | $0 |
Source: Public Records
Map
Nearby Homes
- 140 Libby St
- 150 Libby St
- 120 Libby St
- 110 Libby St
- 125 Libby St
- 135 Libby St
- 145 Libby St
- 145 Libby St Unit 4
- 155 Libby St
- 235 Warsaw Rd
- 220 Warsaw Rd
- 150 Warsaw Rd
- 230 Warsaw Rd
- 240 Warsaw Rd
- 615 5th St
- 605 5th St
- 215 Center St
- 315 Warsaw Rd
- 208 Business Highway 13 Unit Lot 4
- 208 Business Highway 13