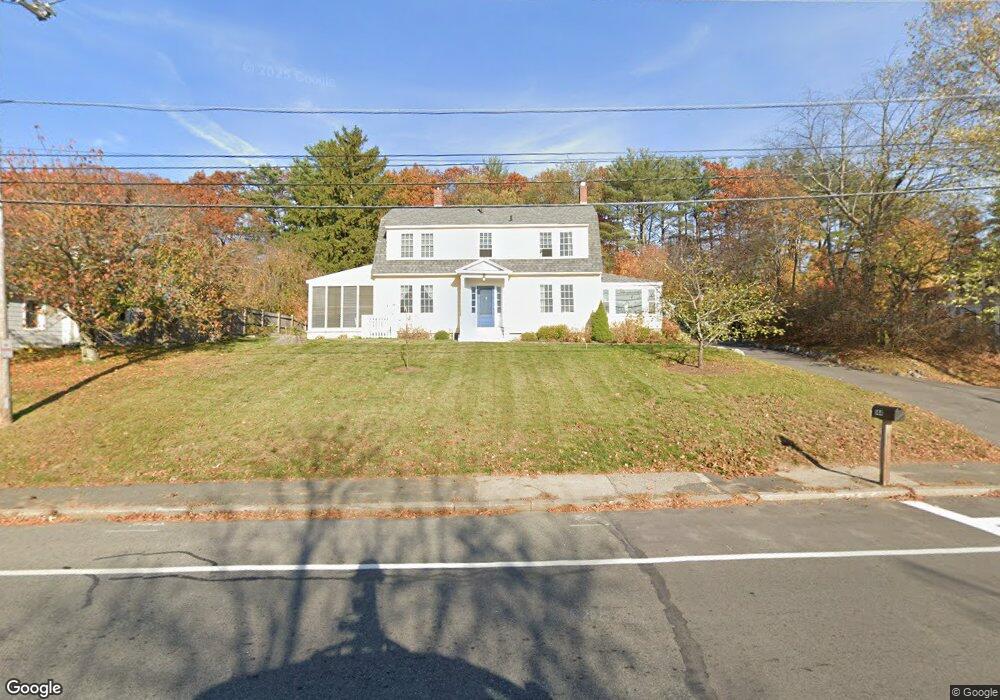
144 Low St Newburyport, MA 01950
Estimated Value: $994,000 - $1,113,465
3
Beds
2
Baths
2,208
Sq Ft
$473/Sq Ft
Est. Value
About This Home
This home is located at 144 Low St, Newburyport, MA 01950 and is currently estimated at $1,044,866, approximately $473 per square foot. 144 Low St is a home located in Essex County with nearby schools including Francis T. Bresnahan Elementary School, Edward G. Molin Elementary School, and Rupert A. Nock Middle School.
Ownership History
Date
Name
Owned For
Owner Type
Purchase Details
Closed on
Dec 28, 2009
Sold by
Kapferer Jerome and Kapferer Laurel S
Bought by
Trach Kirk A
Current Estimated Value
Purchase Details
Closed on
Jun 29, 2007
Sold by
Lyman David and Lyman Jennifer
Bought by
Kapferer Jerome H
Purchase Details
Closed on
May 26, 2000
Sold by
Church Donna M and Tsicouleas Stephanj
Bought by
Lyman David and Lyman Jennifer
Purchase Details
Closed on
Mar 28, 1997
Sold by
Hand Janice R
Bought by
Tsicouleas Stephen J and Church Donna M
Create a Home Valuation Report for This Property
The Home Valuation Report is an in-depth analysis detailing your home's value as well as a comparison with similar homes in the area
Home Values in the Area
Average Home Value in this Area
Purchase History
| Date | Buyer | Sale Price | Title Company |
|---|---|---|---|
| Trach Kirk A | $440,000 | -- | |
| Kapferer Jerome H | $430,000 | -- | |
| Lyman David | $270,000 | -- | |
| Tsicouleas Stephen J | $186,000 | -- |
Source: Public Records
Mortgage History
| Date | Status | Borrower | Loan Amount |
|---|---|---|---|
| Open | Tsicouleas Stephen J | $414,155 | |
| Closed | Tsicouleas Stephen J | $417,000 |
Source: Public Records
Tax History Compared to Growth
Tax History
| Year | Tax Paid | Tax Assessment Tax Assessment Total Assessment is a certain percentage of the fair market value that is determined by local assessors to be the total taxable value of land and additions on the property. | Land | Improvement |
|---|---|---|---|---|
| 2025 | $9,195 | $959,800 | $416,700 | $543,100 |
| 2024 | $8,812 | $883,900 | $378,900 | $505,000 |
| 2023 | $8,658 | $806,100 | $329,600 | $476,500 |
| 2022 | $8,017 | $667,500 | $274,800 | $392,700 |
| 2021 | $7,647 | $605,000 | $250,000 | $355,000 |
| 2020 | $6,997 | $544,900 | $250,000 | $294,900 |
| 2019 | $7,127 | $544,900 | $250,000 | $294,900 |
| 2018 | $6,837 | $515,600 | $238,200 | $277,400 |
| 2017 | $6,664 | $495,500 | $226,900 | $268,600 |
| 2016 | $6,490 | $484,700 | $216,100 | $268,600 |
| 2015 | $6,466 | $484,700 | $216,100 | $268,600 |
Source: Public Records
Map
Nearby Homes
- 138 Low St
- 2 Hunter Dr
- 14 Farrell St
- 29 Columbus Ave
- 14 Norman Ave
- 6 Doe Run Dr
- 6 Summit Place
- 42 Myrtle Ave
- 30 Oakland St Unit 2
- 26 Oakland St
- 347 High St
- 15 Howard St
- 14 Dexter Ln Unit 1
- 27 Warren St Unit 1
- 22 Kent St Unit 1
- 217 Merrimac St Unit 1
- 240 Merrimac St Unit 4
- 2 River St
- 45 Boardman St Unit 1
- 41 Washington St Unit B