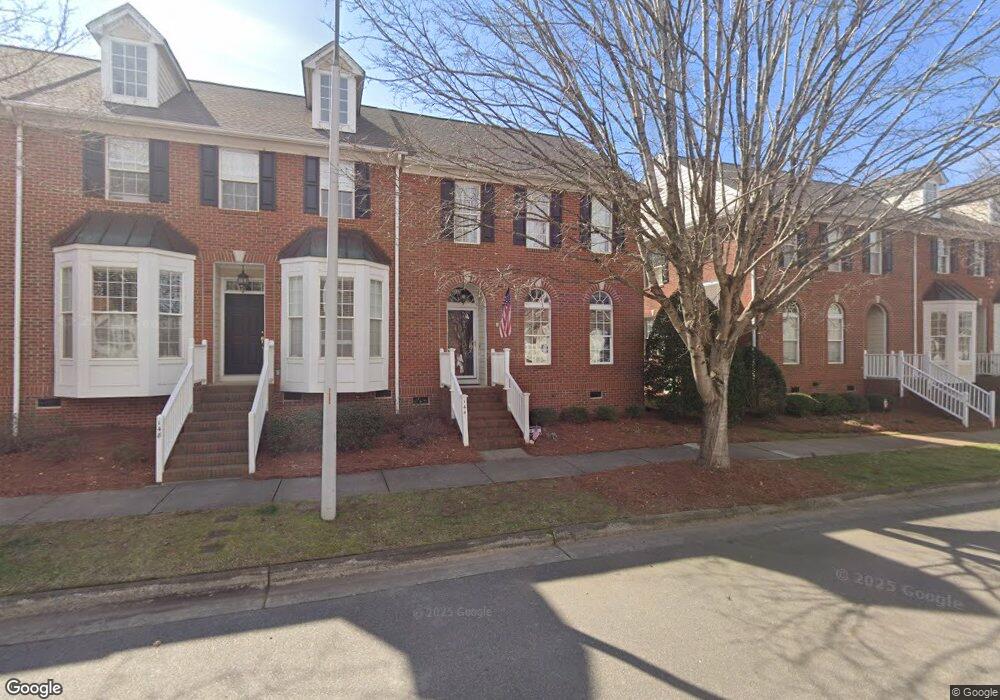
144 Lumina Place Holly Springs, NC 27540
Estimated Value: $383,000 - $416,000
3
Beds
3
Baths
1,690
Sq Ft
$234/Sq Ft
Est. Value
About This Home
This home is located at 144 Lumina Place, Holly Springs, NC 27540 and is currently estimated at $395,604, approximately $234 per square foot. 144 Lumina Place is a home located in Wake County with nearby schools including Holly Springs Elementary School, Holly Ridge Middle School, and Holly Springs High School.
Ownership History
Date
Name
Owned For
Owner Type
Purchase Details
Closed on
Mar 23, 2017
Sold by
Denton Paula A
Bought by
Hudak Angela Quinn
Current Estimated Value
Home Financials for this Owner
Home Financials are based on the most recent Mortgage that was taken out on this home.
Original Mortgage
$105,000
Outstanding Balance
$87,072
Interest Rate
4.17%
Mortgage Type
New Conventional
Estimated Equity
$308,532
Purchase Details
Closed on
May 31, 2001
Sold by
Wall Charles Ryan
Bought by
Newton Jeffrey E and Newton Jeanne P
Home Financials for this Owner
Home Financials are based on the most recent Mortgage that was taken out on this home.
Original Mortgage
$168,150
Interest Rate
6.87%
Purchase Details
Closed on
Sep 28, 1999
Sold by
Crossman Communities Of Nc Inc
Bought by
Wall Charles Ryan
Home Financials for this Owner
Home Financials are based on the most recent Mortgage that was taken out on this home.
Original Mortgage
$135,642
Interest Rate
7.37%
Create a Home Valuation Report for This Property
The Home Valuation Report is an in-depth analysis detailing your home's value as well as a comparison with similar homes in the area
Home Values in the Area
Average Home Value in this Area
Purchase History
| Date | Buyer | Sale Price | Title Company |
|---|---|---|---|
| Hudak Angela Quinn | $220,000 | None Available | |
| Newton Jeffrey E | $177,000 | -- | |
| Wall Charles Ryan | $170,000 | -- |
Source: Public Records
Mortgage History
| Date | Status | Borrower | Loan Amount |
|---|---|---|---|
| Open | Hudak Angela Quinn | $105,000 | |
| Previous Owner | Newton Jeffrey E | $168,150 | |
| Previous Owner | Wall Charles Ryan | $135,642 |
Source: Public Records
Tax History Compared to Growth
Tax History
| Year | Tax Paid | Tax Assessment Tax Assessment Total Assessment is a certain percentage of the fair market value that is determined by local assessors to be the total taxable value of land and additions on the property. | Land | Improvement |
|---|---|---|---|---|
| 2025 | $3,269 | $377,509 | $90,000 | $287,509 |
| 2024 | $3,255 | $377,509 | $90,000 | $287,509 |
| 2023 | $2,610 | $240,156 | $52,000 | $188,156 |
| 2022 | $2,520 | $240,156 | $52,000 | $188,156 |
| 2021 | $2,473 | $240,156 | $52,000 | $188,156 |
| 2020 | $2,473 | $240,156 | $52,000 | $188,156 |
| 2019 | $2,529 | $208,498 | $52,000 | $156,498 |
| 2018 | $2,286 | $208,498 | $52,000 | $156,498 |
| 2017 | $2,204 | $208,498 | $52,000 | $156,498 |
| 2016 | $2,174 | $208,498 | $52,000 | $156,498 |
| 2015 | $1,990 | $187,741 | $42,000 | $145,741 |
| 2014 | $1,922 | $187,741 | $42,000 | $145,741 |
Source: Public Records
Map
Nearby Homes
- 215 Savannah Ridge Rd Unit 215
- 305 Savannah Ridge Rd
- 105 Fountain Ridge Place Unit 105
- 204 Crossway Ln
- 124 Kingsport Rd
- 104 Crossway Ln
- 129 Starwood Ln
- 0/416 Holly Springs Rd
- 4809 Greenpoint Ln
- 4924 Gable Ridge Ln
- 5120 Linksland Dr
- 108 Warm Wood Ln
- 201 Seagraves Creek Ln
- 204 Seagraves Creek Ln
- 113 Seagraves Creek Ln
- 200 Seagraves Creek Ln
- 132 Seagraves Creek Ln
- 124 Seagraves Creek Ln
- 120 Seagraves Creek Ln
- 228 Masden Rd
- 148 Lumina Place
- 140 Lumina Place
- 152 Lumina Place
- 136 Lumina Place
- 156 Lumina Place
- 132 Lumina Place
- 160 Lumina Place
- 128 Lumina Place
- 164 Lumina Place
- 124 Lumina Place
- 166 Lumina Place
- 149 Lumina Place
- 168 Lumina Place
- 145 Lumina Place Unit 44
- 153 Lumina Place Unit 46
- 141 Lumina Place
- 120 Lumina Place
- 157 Lumina Place
- 137 Lumina Place
- 137 Lumina Place Unit 42