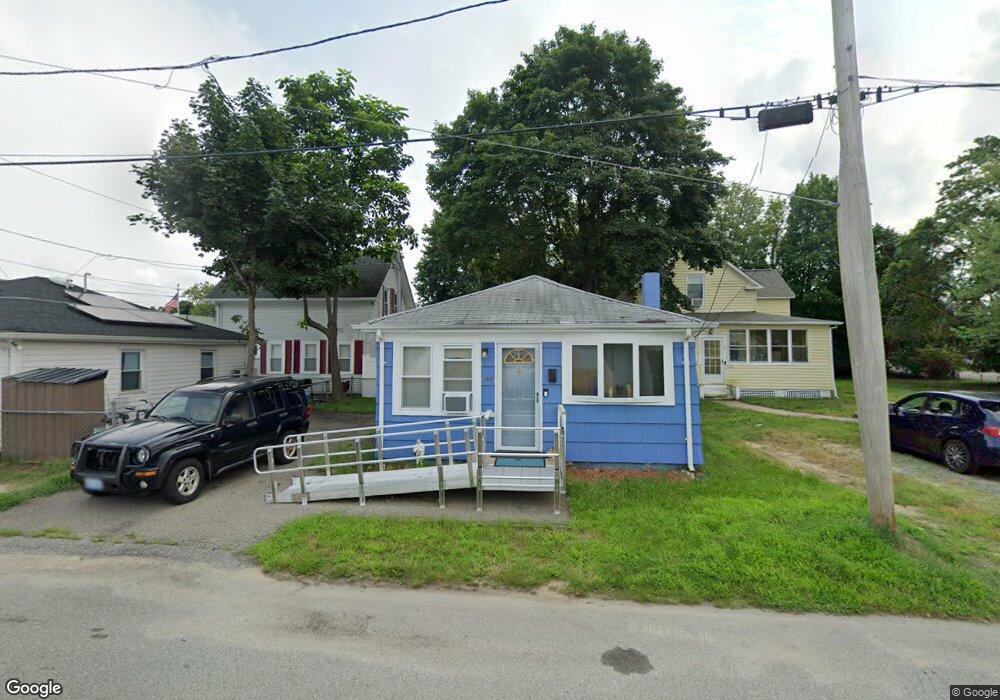
144 Mohawk Ave Warwick, RI 02889
Oakland Beach NeighborhoodEstimated Value: $257,775 - $293,000
2
Beds
1
Bath
576
Sq Ft
$477/Sq Ft
Est. Value
About This Home
This home is located at 144 Mohawk Ave, Warwick, RI 02889 and is currently estimated at $274,694, approximately $476 per square foot. 144 Mohawk Ave is a home located in Kent County with nearby schools including Saint Kevin School and Bishop Hendricken High School.
Ownership History
Date
Name
Owned For
Owner Type
Purchase Details
Closed on
Jun 9, 2004
Sold by
Kemp Christopher S
Bought by
Fellela Sandra J
Current Estimated Value
Purchase Details
Closed on
Aug 21, 2001
Sold by
Castellanos Anne
Bought by
Kemp Christopher S
Purchase Details
Closed on
Aug 12, 1999
Sold by
Hellested Leo and Hellested Knud
Bought by
Castellanos Anne
Purchase Details
Closed on
Mar 3, 1999
Sold by
Aames Capital Corp
Bought by
Hillested Knud and Hillested Leo
Purchase Details
Closed on
Mar 31, 1994
Sold by
Ge Capital Mtg Svc
Bought by
Mcdonough David A
Create a Home Valuation Report for This Property
The Home Valuation Report is an in-depth analysis detailing your home's value as well as a comparison with similar homes in the area
Home Values in the Area
Average Home Value in this Area
Purchase History
| Date | Buyer | Sale Price | Title Company |
|---|---|---|---|
| Fellela Sandra J | $123,500 | -- | |
| Kemp Christopher S | $64,000 | -- | |
| Castellanos Anne | $49,000 | -- | |
| Hillested Knud | $22,000 | -- | |
| Mcdonough David A | $26,000 | -- |
Source: Public Records
Mortgage History
| Date | Status | Borrower | Loan Amount |
|---|---|---|---|
| Open | Mcdonough David A | $7,000 | |
| Open | Mcdonough David A | $135,000 |
Source: Public Records
Tax History
| Year | Tax Paid | Tax Assessment Tax Assessment Total Assessment is a certain percentage of the fair market value that is determined by local assessors to be the total taxable value of land and additions on the property. | Land | Improvement |
|---|---|---|---|---|
| 2025 | $2,883 | $227,000 | $76,400 | $150,600 |
| 2024 | $2,444 | $168,900 | $62,400 | $106,500 |
| 2023 | $2,397 | $168,900 | $62,400 | $106,500 |
| 2022 | $1,841 | $98,300 | $37,200 | $61,100 |
| 2021 | $1,841 | $98,300 | $37,200 | $61,100 |
| 2020 | $1,841 | $98,300 | $37,200 | $61,100 |
| 2019 | $1,841 | $98,300 | $37,200 | $61,100 |
| 2018 | $1,589 | $76,400 | $31,800 | $44,600 |
| 2017 | $1,546 | $76,400 | $31,800 | $44,600 |
| 2016 | $1,546 | $76,400 | $31,800 | $44,600 |
| 2015 | $1,762 | $84,900 | $40,500 | $44,400 |
| 2014 | $1,703 | $84,900 | $40,500 | $44,400 |
| 2013 | $1,680 | $84,900 | $40,500 | $44,400 |
Source: Public Records
Map
Nearby Homes
- 79 Suburban Pkwy
- 52 Uncas St
- 83 Ottawa Ave
- 90 Huron St
- 357 Pequot Ave
- 107 Coburn St
- 0 Sea View Dr
- 188 Wood St
- 75 Northup St
- 73 Pinehurst Ave
- 71 Pinehurst Ave
- 79 Pinehurst Ave
- 81 Pinehurst Ave
- 31 Oakhurst Ave
- 585 Meadow View Ave
- 176 Canfield Ave
- 165 Canfield Ave
- 30 White Rock Rd
- 215 Rocky Point Ave
- 201 Hollis Ave
Your Personal Tour Guide
Ask me questions while you tour the home.