Estimated Value: $240,000 - $347,000
4
Beds
1
Bath
1,120
Sq Ft
$273/Sq Ft
Est. Value
About This Home
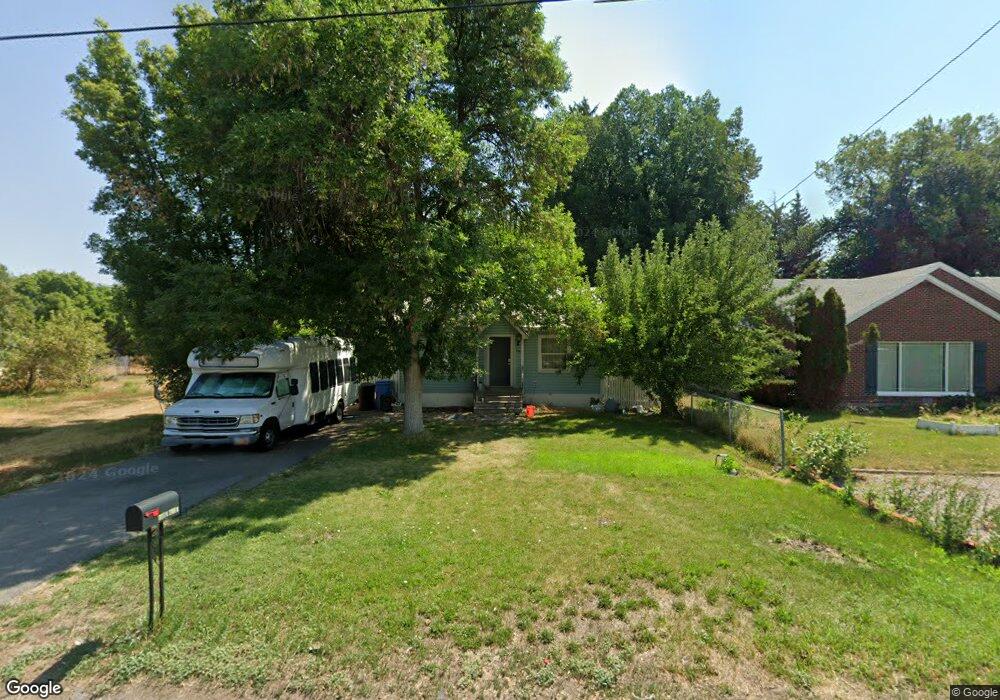
This home is located at 144 N 200 W, Hyrum, UT 84319 and is currently estimated at $305,876, approximately $273 per square foot. 144 N 200 W is a home located in Cache County with nearby schools including Lincoln School, South Cache Middle School, and Mountain Crest High School.
Ownership History
Date
Name
Owned For
Owner Type
Purchase Details
Closed on
Jul 30, 2022
Sold by
Ricks Edward
Bought by
Edward And Mickey Ricks Revocable Family Trus
Current Estimated Value
Purchase Details
Closed on
Jun 20, 2018
Sold by
Chappell Christopher D and Chappell Kylee
Bought by
Chappell Christopher D
Purchase Details
Closed on
Sep 7, 2017
Sold by
Mcpolin Kelly Dean
Bought by
Chappell Christopher D and Chappell Kylee
Home Financials for this Owner
Home Financials are based on the most recent Mortgage that was taken out on this home.
Original Mortgage
$147,741
Interest Rate
3.9%
Mortgage Type
New Conventional
Purchase Details
Closed on
Sep 20, 2013
Sold by
Jpmorgan Chase Bank National Association
Bought by
Mcpolin Kelly Dean
Home Financials for this Owner
Home Financials are based on the most recent Mortgage that was taken out on this home.
Original Mortgage
$100,000
Interest Rate
4.36%
Mortgage Type
New Conventional
Purchase Details
Closed on
Jun 11, 2013
Sold by
Walden Maurice A and Walden Deborah L
Bought by
Jpmorgan Chase Bank National Association
Purchase Details
Closed on
Sep 24, 2009
Sold by
Vigil Carl and Cordova Carl
Bought by
Walden Maurice A and Walden Deborah L
Home Financials for this Owner
Home Financials are based on the most recent Mortgage that was taken out on this home.
Original Mortgage
$115,260
Interest Rate
5.25%
Mortgage Type
New Conventional
Purchase Details
Closed on
Mar 27, 2007
Sold by
Soderborg Taylor and Soderborg Rhonda A
Bought by
Vigil Carl and Vigil Michelle
Home Financials for this Owner
Home Financials are based on the most recent Mortgage that was taken out on this home.
Original Mortgage
$87,400
Interest Rate
7.95%
Mortgage Type
Adjustable Rate Mortgage/ARM
Purchase Details
Closed on
Aug 31, 2001
Sold by
Kennington Kelly R and Kennington Kristi L
Bought by
Soderborg Taylor and Soderborg Rhonda A
Home Financials for this Owner
Home Financials are based on the most recent Mortgage that was taken out on this home.
Original Mortgage
$85,680
Interest Rate
7.09%
Mortgage Type
FHA
Create a Home Valuation Report for This Property
The Home Valuation Report is an in-depth analysis detailing your home's value as well as a comparison with similar homes in the area
Home Values in the Area
Average Home Value in this Area
Purchase History
| Date | Buyer | Sale Price | Title Company |
|---|---|---|---|
| Edward And Mickey Ricks Revocable Family Trus | -- | -- | |
| Chappell Christopher D | -- | None Available | |
| Chappell Christopher D | -- | None Available | |
| Mcpolin Kelly Dean | -- | American Secure Title Logan | |
| Jpmorgan Chase Bank National Association | $85,000 | Etitle Insurance Agency | |
| Walden Maurice A | -- | Hickman Land Title Company | |
| Vigil Carl | -- | Northern Title Company | |
| Vigil Carl | -- | Northern Title Company | |
| Soderborg Taylor | -- | American Secure Title |
Source: Public Records
Mortgage History
| Date | Status | Borrower | Loan Amount |
|---|---|---|---|
| Previous Owner | Chappell Christopher D | $147,741 | |
| Previous Owner | Mcpolin Kelly Dean | $100,000 | |
| Previous Owner | Walden Maurice A | $115,260 | |
| Previous Owner | Vigil Carl | $87,400 | |
| Previous Owner | Soderborg Taylor | $85,680 |
Source: Public Records
Tax History Compared to Growth
Tax History
| Year | Tax Paid | Tax Assessment Tax Assessment Total Assessment is a certain percentage of the fair market value that is determined by local assessors to be the total taxable value of land and additions on the property. | Land | Improvement |
|---|---|---|---|---|
| 2025 | $96 | $137,660 | $0 | $0 |
| 2024 | $1,022 | $137,045 | $0 | $0 |
| 2023 | $1,199 | $153,685 | $0 | $0 |
| 2022 | $1,233 | $151,525 | $0 | $0 |
| 2021 | $1,165 | $220,580 | $63,670 | $156,910 |
| 2020 | $1,038 | $184,370 | $63,670 | $120,700 |
| 2019 | $936 | $156,360 | $35,660 | $120,700 |
| 2018 | $695 | $112,268 | $35,660 | $76,608 |
| 2017 | $683 | $57,235 | $0 | $0 |
| 2016 | $698 | $57,235 | $0 | $0 |
| 2015 | $700 | $57,235 | $0 | $0 |
| 2014 | $685 | $57,235 | $0 | $0 |
| 2013 | -- | $48,475 | $0 | $0 |
Source: Public Records
Map
Nearby Homes