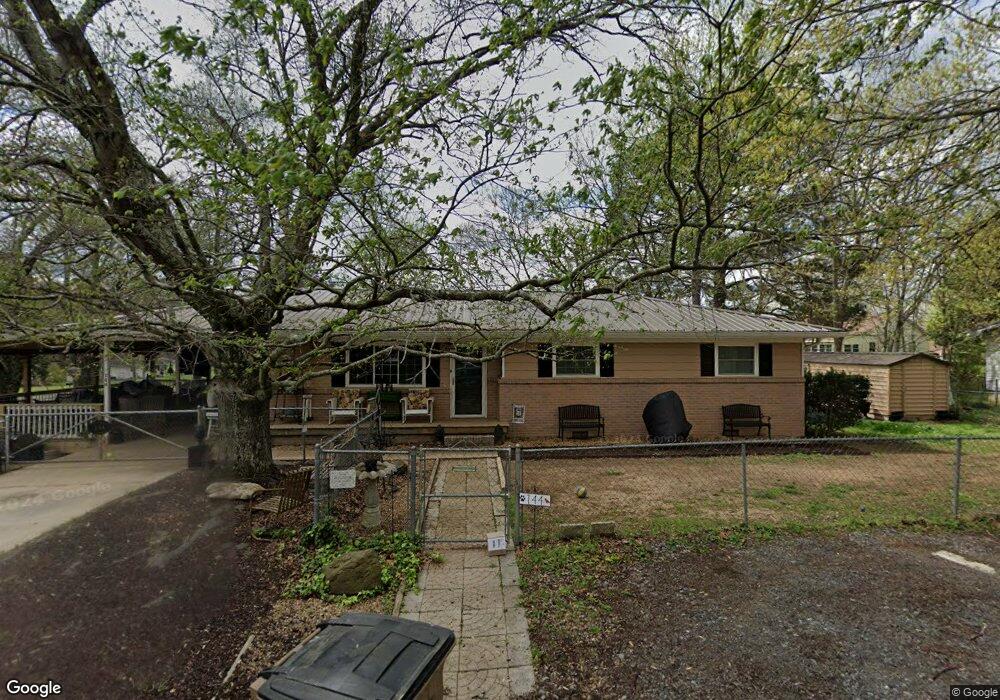
144 N Cherry St Tunnel Hill, GA 30755
Estimated Value: $192,000 - $256,000
3
Beds
1
Bath
1,326
Sq Ft
$165/Sq Ft
Est. Value
About This Home
This home is located at 144 N Cherry St, Tunnel Hill, GA 30755 and is currently estimated at $219,021, approximately $165 per square foot. 144 N Cherry St is a home located in Whitfield County with nearby schools including Tunnel Hill Elementary School, Westside Middle School, and Northwest Whitfield County High School.
Ownership History
Date
Name
Owned For
Owner Type
Purchase Details
Closed on
Sep 6, 2024
Sold by
Camilleri Sonya L and Camilleri Gregory M
Bought by
Bat Construction Llc
Current Estimated Value
Purchase Details
Closed on
Jul 8, 2009
Sold by
Bibbey Mickey L
Bought by
Camilleri Sonya
Purchase Details
Closed on
Dec 3, 2008
Sold by
Not Provided
Bought by
Camilleri Sonya and Camilleri Greg
Purchase Details
Closed on
Oct 8, 2008
Sold by
Not Provided
Bought by
Camilleri Sonya and Camilleri Greg
Purchase Details
Closed on
Apr 1, 2008
Sold by
Not Provided
Bought by
Camilleri Sonya and Camilleri Greg
Purchase Details
Closed on
May 23, 2005
Sold by
Forshee James
Bought by
Harrell James D
Purchase Details
Closed on
May 22, 2005
Sold by
Not Provided
Bought by
Camilleri Sonya and Camilleri Greg
Purchase Details
Closed on
Mar 1, 1997
Bought by
Doty Cheryl and Forshee James R
Create a Home Valuation Report for This Property
The Home Valuation Report is an in-depth analysis detailing your home's value as well as a comparison with similar homes in the area
Home Values in the Area
Average Home Value in this Area
Purchase History
| Date | Buyer | Sale Price | Title Company |
|---|---|---|---|
| Bat Construction Llc | $60,000 | None Listed On Document | |
| Camilleri Sonya | -- | -- | |
| Camilleri Sonya | $75,000 | -- | |
| Camilleri Sonya | $44,900 | -- | |
| Camilleri Sonya | $82,949 | -- | |
| Harrell James D | $98,000 | -- | |
| Camilleri Sonya | -- | -- | |
| Doty Cheryl | -- | -- |
Source: Public Records
Tax History Compared to Growth
Tax History
| Year | Tax Paid | Tax Assessment Tax Assessment Total Assessment is a certain percentage of the fair market value that is determined by local assessors to be the total taxable value of land and additions on the property. | Land | Improvement |
|---|---|---|---|---|
| 2024 | $1,331 | $72,768 | $10,000 | $62,768 |
| 2023 | $1,331 | $51,353 | $8,000 | $43,353 |
| 2022 | $922 | $39,812 | $8,000 | $31,812 |
| 2021 | $922 | $39,812 | $8,000 | $31,812 |
| 2020 | $934 | $39,540 | $8,000 | $31,540 |
| 2019 | $943 | $39,540 | $8,000 | $31,540 |
| 2018 | $953 | $39,540 | $8,000 | $31,540 |
| 2017 | $954 | $39,540 | $8,000 | $31,540 |
| 2016 | $770 | $34,270 | $4,200 | $30,070 |
| 2014 | $631 | $30,840 | $4,200 | $26,640 |
| 2013 | -- | $29,338 | $4,200 | $25,138 |
Source: Public Records
Map
Nearby Homes
- 107 N Varnell Rd
- 203 S Cherry St
- 400 Crawford Terrace
- 109 Lakeshore Dr N
- 158 Handcar Way
- 360 N Lakeshore Dr
- 301 Harper Valley Dr
- 0 Mount View Dr Unit RTC2958565
- 0 Mount View Dr Unit 1517505
- 3414 Chattanooga Rd
- 00 Old Chattanooga Rd
- 0 Dockwell Unit RTC2958570
- 0 Dockwell Unit RTC2958569
- 0 Dockwell Unit 1517510
- 0 Dockwell Unit 1517509
- Lot 45 Robert Fuller Rd
- Lot 47 Robert Fuller Rd
- Lot 44 Robert Fuller Rd
- Lot 43 Robert Fuller Rd
- Lot 51 Robert Fuller Rd
- 201 N Varnell Rd
- TRACT 1 Keys Rd Unit TRACT 1
- 142 N Cherry St
- N N Varnell Rd
- 132 N Varnell Rd
- 141 N Cherry St
- 143 N Cherry St
- 135 N Cherry St
- 128 N Varnell Rd
- 131 N Cherry St
- 136 Cherry Ln
- 124 N Varnell Rd
- 132 N Cherry St
- 140 N Cherry St
- 207 N Varnell Rd
- 125 Russell Ln
- 125 Russell Ln Unit 1
- 210 N Varnell Rd
- 216 N Varnell Rd
- 0 Georgia 201