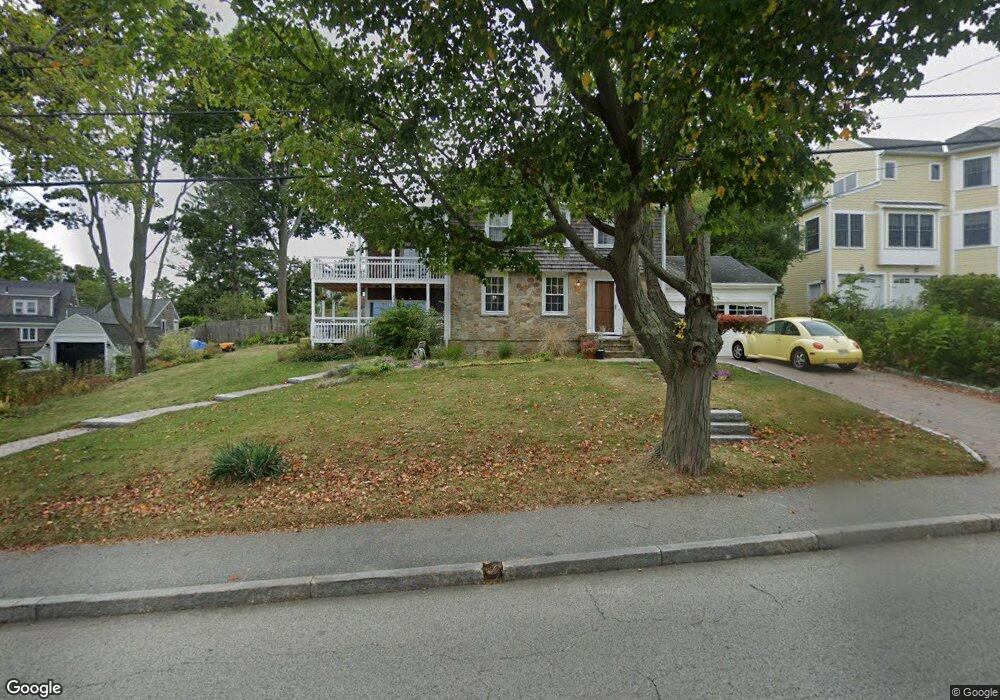
144 Otis St Hingham, MA 02043
Crow Point NeighborhoodEstimated Value: $1,141,000 - $1,836,000
5
Beds
4
Baths
2,849
Sq Ft
$530/Sq Ft
Est. Value
About This Home
This home is located at 144 Otis St, Hingham, MA 02043 and is currently estimated at $1,510,505, approximately $530 per square foot. 144 Otis St is a home located in Plymouth County with nearby schools including William L. Foster Elementary School, Hingham Middle School, and Hingham High School.
Ownership History
Date
Name
Owned For
Owner Type
Purchase Details
Closed on
Jun 1, 2018
Sold by
Vakil Govind S and Vakil Usha
Bought by
144 Otis Street Rt
Current Estimated Value
Purchase Details
Closed on
Apr 15, 1979
Bought by
Vakil Govind Singh and Vakil Usha
Create a Home Valuation Report for This Property
The Home Valuation Report is an in-depth analysis detailing your home's value as well as a comparison with similar homes in the area
Home Values in the Area
Average Home Value in this Area
Purchase History
| Date | Buyer | Sale Price | Title Company |
|---|---|---|---|
| 144 Otis Street Rt | -- | -- | |
| Vakil Govind Singh | $56,000 | -- |
Source: Public Records
Mortgage History
| Date | Status | Borrower | Loan Amount |
|---|---|---|---|
| Previous Owner | Vakil Govind Singh | $120,000 | |
| Previous Owner | Vakil Govind Singh | $50,000 | |
| Previous Owner | Vakil Govind Singh | $25,000 |
Source: Public Records
Tax History
| Year | Tax Paid | Tax Assessment Tax Assessment Total Assessment is a certain percentage of the fair market value that is determined by local assessors to be the total taxable value of land and additions on the property. | Land | Improvement |
|---|---|---|---|---|
| 2025 | $12,891 | $1,205,900 | $685,200 | $520,700 |
| 2024 | $12,743 | $1,174,500 | $685,200 | $489,300 |
| 2023 | $11,301 | $1,130,100 | $685,200 | $444,900 |
| 2022 | $9,594 | $829,900 | $502,500 | $327,400 |
| 2021 | $9,700 | $822,000 | $523,400 | $298,600 |
| 2020 | $9,478 | $822,000 | $523,400 | $298,600 |
| 2019 | $9,481 | $802,800 | $523,400 | $279,400 |
| 2018 | $9,449 | $802,800 | $523,400 | $279,400 |
| 2017 | $9,445 | $771,000 | $570,300 | $200,700 |
| 2016 | $9,291 | $743,900 | $543,200 | $200,700 |
| 2015 | $8,997 | $718,000 | $517,300 | $200,700 |
Source: Public Records
Map
Nearby Homes
- 34 Otis Hill Rd
- 12 Daley Rd
- 17 Paige St
- 29 Chief Justice Cushing Hwy
- 225 South St Unit 1
- 21 Hersey St
- 19 Lantern Ln
- 43 Park View Dr
- 9 Barnes Rd
- 10R Martins Ln
- 16 Foley Beach Rd
- 22 Del Prete Dr
- 112 Martins Ln
- 81 Kimball Beach Rd
- 6 Adams Ct
- 151 Stayner Dr Unit 151
- 132 Hms Stayner Dr Unit 132
- 1 Rockland St
- 2 Beach Ln
- 8 Evergreen Ln
Your Personal Tour Guide
Ask me questions while you tour the home.