N
Buyer's Agent in 2021
NONMLS Sale
NON MLS MEMBER

Estimated Value: $368,260 - $432,000
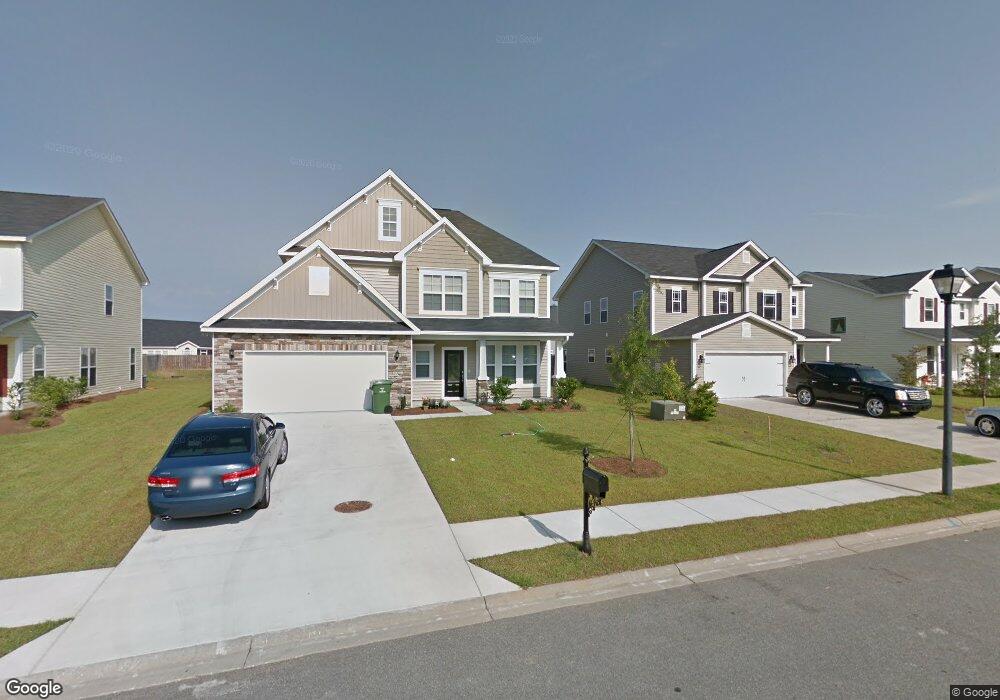
We’re offering a no application fee and reduced deposit special on this home! Apply today and we’ll waive your application fee. When you sign a lease, and your security deposit will be just 75% of your base rent (taxes and fees not included). Plus, 20-month lease options are available for a limited time. The application fee special is valid for new applicants who apply by September 30, 2025. The reduced deposit special is valid for new applicants who sign a 12-month (or longer) lease by September 30, 2025. 20-month lease options are valid for new applicants who sign a 20-month lease, limited to the first 500 executed leases. Base rent will remain at the 12-month lease rate for the duration of the 20-month term. Offers are contingent on application approval and execution of a lease agreement. Other terms and conditions may apply. This property is professionally managed by AMH, a leading single-family rental company. We work to simplify your rental experience by offering self-guided tours and a streamlined leasing process you can complete all online, all on your own schedule. Once moved in, we provide maintenance support that you can rely on, so you can enjoy your weekends stress-free. We look forward to welcoming you home! See Today, Sign Today™ Take a self-guided tour of this property using our Let Yourself In® service to view the space on your own schedule, without an agent. And if your documents are in order, you might even view a home and sign a lease on the same day! Utilities, taxes, and other fees may apply. Please verify and confirm all information before signing a lease. If you have questions, don’t hesitate to contact us at the telephone number on this property listing. All lease applications, documentation, and initial payments for this property, must be submitted directly through or by phone. The photos, renderings, or other images of the properties on our website, are for illustrative purposes only, and may vary from the features, amenities, or phase of construction. We do not advertise properties on Craigslist, Facebook Marketplace, or other classified advertising websites. If you believe one of our residences is listed there, please notify us. For further description of applicable fees, please go to our website.
Last Buyer's Agent
NONMLS Sale
NON MLS MEMBER License #NMLS
| Date | Buyer | Sale Price | Title Company |
|---|---|---|---|
| Ah4r Properties Two Llc | $327,100 | -- | |
| Henderson Gregory L | $244,900 | -- | |
| Catamount Properties 2018 Llc | $180,000 | -- | |
| Goodson Jonathan D | $186,198 | -- | |
| Pine Barren Partners Llc | -- | -- | |
| Pine Barren Partners Llc | $1,801,440 | -- |
| Date | Status | Borrower | Loan Amount |
|---|---|---|---|
| Previous Owner | Henderson Gregory L | $240,463 |
| Date | Event | Price | List to Sale | Price per Sq Ft |
|---|---|---|---|---|
| 09/22/2025 09/22/25 | Off Market | $2,670 | -- | -- |
| 09/17/2025 09/17/25 | Price Changed | $2,670 | +0.9% | $1 / Sq Ft |
| 08/19/2025 08/19/25 | Price Changed | $2,645 | -0.6% | $1 / Sq Ft |
| 08/06/2025 08/06/25 | For Rent | $2,660 | 0.0% | -- |
| 10/14/2021 10/14/21 | Sold | $327,100 | +4.8% | $134 / Sq Ft |
| 10/14/2021 10/14/21 | For Sale | $312,000 | -- | $128 / Sq Ft |
| Year | Tax Paid | Tax Assessment Tax Assessment Total Assessment is a certain percentage of the fair market value that is determined by local assessors to be the total taxable value of land and additions on the property. | Land | Improvement |
|---|---|---|---|---|
| 2025 | $5,472 | $150,800 | $24,000 | $126,800 |
| 2024 | $40 | $149,440 | $24,000 | $125,440 |
| 2023 | $4,027 | $126,120 | $12,160 | $113,960 |
| 2022 | $3,382 | $114,960 | $12,160 | $102,800 |
| 2021 | $3,453 | $98,680 | $12,160 | $86,520 |
| 2020 | $3,074 | $95,080 | $12,160 | $82,920 |
| 2019 | $3,073 | $89,920 | $12,160 | $77,760 |
| 2018 | $2,780 | $86,880 | $12,160 | $74,720 |
| 2017 | $2,766 | $87,280 | $12,160 | $75,120 |
| 2016 | $2,766 | $86,200 | $12,160 | $74,040 |
| 2015 | $2,783 | $86,320 | $12,160 | $74,160 |
| 2014 | $3,651 | $77,360 | $0 | $0 |
N
Buyer's Agent in 2021
NONMLS Sale
NON MLS MEMBER
Source: Hive MLS
MLS Number: SA259519
APN: 51023B04021
Disclaimer: Certain information contained herein is derived from information provided by parties other than Homes.com. All information provided is deemed reliable, but is not guaranteed to be accurate and should be independently verified.
![]() IDX information is provided exclusively for personal, non-commercial use, and may not be used for any purpose other than to identify prospective properties consumers may be interested in purchasing.
IDX information is provided exclusively for personal, non-commercial use, and may not be used for any purpose other than to identify prospective properties consumers may be interested in purchasing.
Information is deemed reliable but not guaranteed.
Ask me questions while you tour the home.