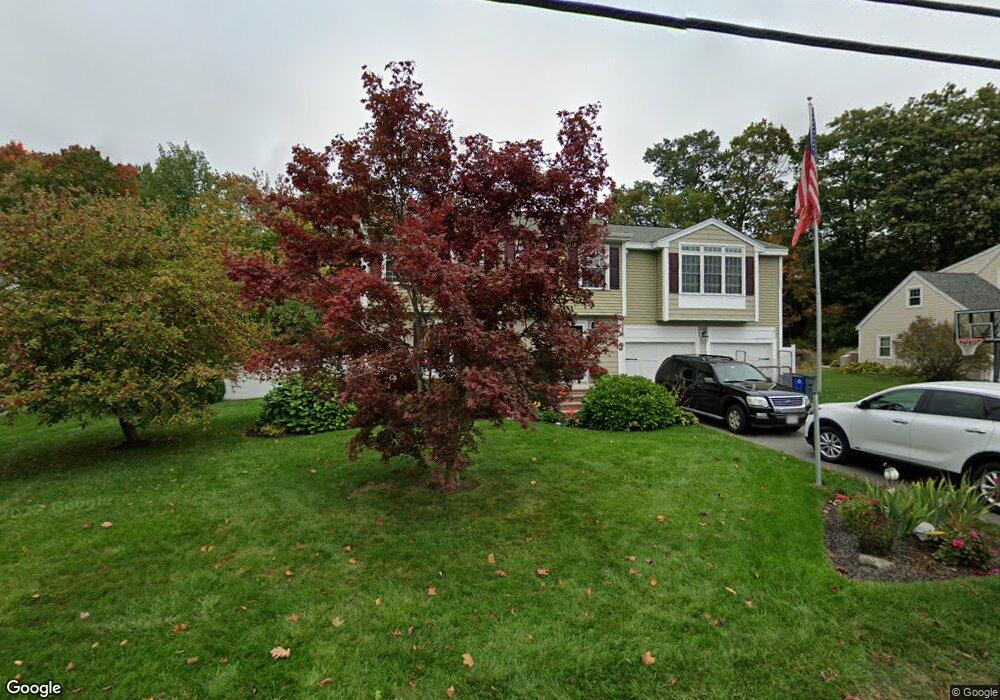
144 Pitman St Methuen, MA 01844
The East End NeighborhoodEstimated Value: $672,590 - $731,000
3
Beds
2
Baths
1,516
Sq Ft
$463/Sq Ft
Est. Value
About This Home
This home is located at 144 Pitman St, Methuen, MA 01844 and is currently estimated at $701,398, approximately $462 per square foot. 144 Pitman St is a home located in Essex County with nearby schools including South Point Elementary School, Methuen High School, and Community Day Charter Public School - Gateway.
Ownership History
Date
Name
Owned For
Owner Type
Purchase Details
Closed on
Jul 2, 2002
Sold by
Costa Stephen R and Costa Cynthia A
Bought by
Silverio Todd M and Silverio Amy E
Current Estimated Value
Home Financials for this Owner
Home Financials are based on the most recent Mortgage that was taken out on this home.
Original Mortgage
$265,524
Interest Rate
6.92%
Mortgage Type
Purchase Money Mortgage
Purchase Details
Closed on
Feb 24, 1992
Sold by
Fielding Alan P
Bought by
Costa Stephen R
Create a Home Valuation Report for This Property
The Home Valuation Report is an in-depth analysis detailing your home's value as well as a comparison with similar homes in the area
Home Values in the Area
Average Home Value in this Area
Purchase History
| Date | Buyer | Sale Price | Title Company |
|---|---|---|---|
| Silverio Todd M | $288,000 | -- | |
| Silverio Todd M | $288,000 | -- | |
| Costa Stephen R | $130,000 | -- | |
| Costa Stephen R | $130,000 | -- |
Source: Public Records
Mortgage History
| Date | Status | Borrower | Loan Amount |
|---|---|---|---|
| Open | Costa Stephen R | $350,482 | |
| Closed | Costa Stephen R | $265,524 |
Source: Public Records
Tax History Compared to Growth
Tax History
| Year | Tax Paid | Tax Assessment Tax Assessment Total Assessment is a certain percentage of the fair market value that is determined by local assessors to be the total taxable value of land and additions on the property. | Land | Improvement |
|---|---|---|---|---|
| 2025 | $5,909 | $558,500 | $207,200 | $351,300 |
| 2024 | $5,902 | $543,500 | $189,000 | $354,500 |
| 2023 | $5,679 | $485,400 | $168,000 | $317,400 |
| 2022 | $5,407 | $414,300 | $140,000 | $274,300 |
| 2021 | $5,099 | $386,600 | $133,000 | $253,600 |
| 2020 | $5,056 | $376,200 | $133,000 | $243,200 |
| 2019 | $4,894 | $344,900 | $119,000 | $225,900 |
| 2018 | $4,770 | $334,300 | $119,000 | $215,300 |
| 2017 | $4,635 | $316,400 | $119,000 | $197,400 |
| 2016 | $4,529 | $305,800 | $112,000 | $193,800 |
| 2015 | $4,360 | $298,600 | $112,000 | $186,600 |
Source: Public Records
Map
Nearby Homes
- 45 Christopher Dr Unit 101
- 29 Pitman St
- 29 Wallace St
- 17 Ferry Rd
- 2 Goodrich Ave
- 27 Russell Farm Dr
- 23 Constitution Way Unit 23
- 23 Constitution Way
- 95 Pilgrim Cir Unit 95
- 49 Golf Ave
- 107 Farrwood Dr Unit 107
- 86 Comet Rd
- 369 Farrwood Dr
- 68 Sterling Ln
- 406 Farrwood Dr Unit 406
- 414 Farrwood Dr Unit 414
- 128 Pleasant Valley St
- 128 Bradford St
- 122 Pleasant Valley St
- 6 Aberdeen Rd