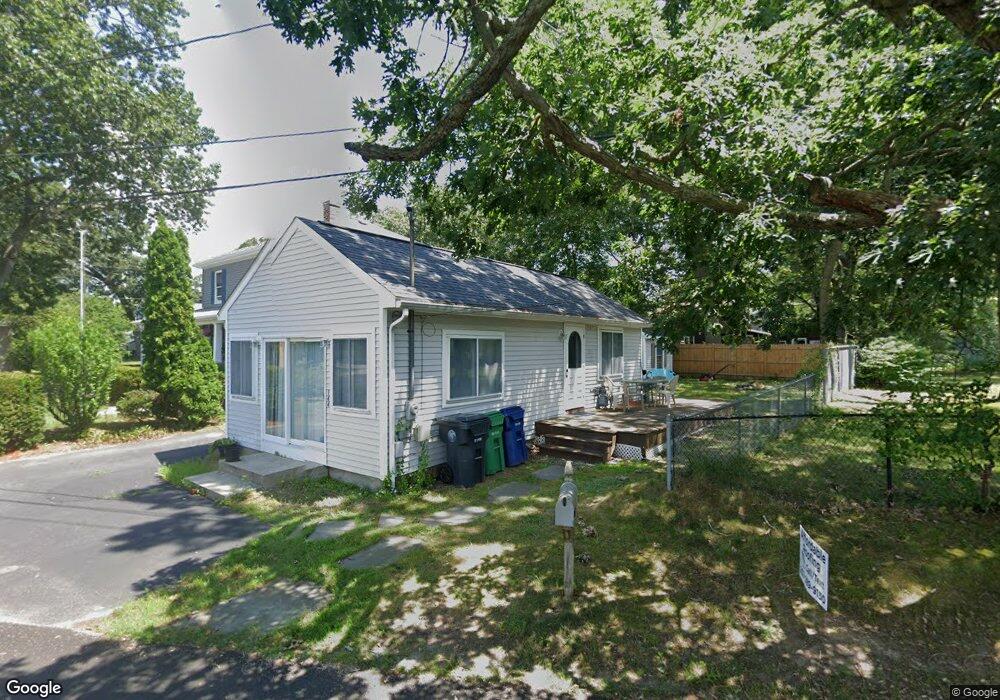
144 Sea View Dr Warwick, RI 02889
Oakland Beach NeighborhoodEstimated Value: $297,000 - $335,000
2
Beds
1
Bath
480
Sq Ft
$653/Sq Ft
Est. Value
About This Home
This home is located at 144 Sea View Dr, Warwick, RI 02889 and is currently estimated at $313,437, approximately $652 per square foot. 144 Sea View Dr is a home located in Kent County with nearby schools including Saint Kevin School, St Rose Of Lima School, and Bishop Hendricken High School.
Ownership History
Date
Name
Owned For
Owner Type
Purchase Details
Closed on
Jun 2, 1998
Sold by
Laclair Jean V Est and Mulholland
Bought by
Peters Scott
Current Estimated Value
Home Financials for this Owner
Home Financials are based on the most recent Mortgage that was taken out on this home.
Original Mortgage
$48,216
Outstanding Balance
$9,169
Interest Rate
7.12%
Mortgage Type
Purchase Money Mortgage
Estimated Equity
$304,268
Create a Home Valuation Report for This Property
The Home Valuation Report is an in-depth analysis detailing your home's value as well as a comparison with similar homes in the area
Home Values in the Area
Average Home Value in this Area
Purchase History
| Date | Buyer | Sale Price | Title Company |
|---|---|---|---|
| Peters Scott | $37,000 | -- |
Source: Public Records
Mortgage History
| Date | Status | Borrower | Loan Amount |
|---|---|---|---|
| Open | Peters Scott | $48,216 |
Source: Public Records
Tax History
| Year | Tax Paid | Tax Assessment Tax Assessment Total Assessment is a certain percentage of the fair market value that is determined by local assessors to be the total taxable value of land and additions on the property. | Land | Improvement |
|---|---|---|---|---|
| 2025 | $3,757 | $295,800 | $145,000 | $150,800 |
| 2024 | $2,910 | $201,100 | $119,100 | $82,000 |
| 2023 | $2,854 | $201,100 | $119,100 | $82,000 |
| 2022 | $2,214 | $118,200 | $72,300 | $45,900 |
| 2021 | $2,214 | $118,200 | $72,300 | $45,900 |
| 2020 | $2,214 | $118,200 | $72,300 | $45,900 |
| 2019 | $2,214 | $118,200 | $72,300 | $45,900 |
| 2018 | $2,070 | $99,500 | $65,800 | $33,700 |
| 2017 | $2,014 | $99,500 | $65,800 | $33,700 |
| 2016 | $2,014 | $99,500 | $65,800 | $33,700 |
| 2015 | $2,067 | $99,600 | $67,200 | $32,400 |
| 2014 | $1,998 | $99,600 | $67,200 | $32,400 |
| 2013 | $1,971 | $99,600 | $67,200 | $32,400 |
Source: Public Records
Map
Nearby Homes
Your Personal Tour Guide
Ask me questions while you tour the home.