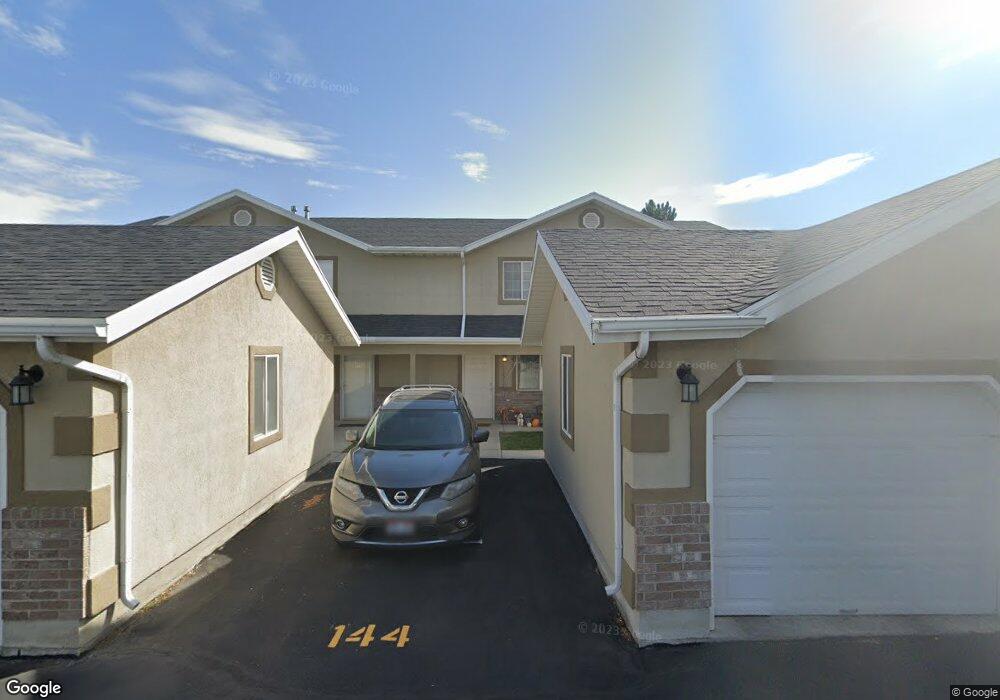
144 W 1310 S Logan, UT 84321
Woodruff NeighborhoodEstimated Value: $249,000 - $267,000
2
Beds
2
Baths
1,190
Sq Ft
$218/Sq Ft
Est. Value
About This Home
This home is located at 144 W 1310 S, Logan, UT 84321 and is currently estimated at $259,590, approximately $218 per square foot. 144 W 1310 S is a home located in Cache County with nearby schools including Hillcrest Elementary School, Mount Logan Middle School, and Logan High School.
Ownership History
Date
Name
Owned For
Owner Type
Purchase Details
Closed on
Sep 8, 2017
Sold by
Rincon Alejandro
Bought by
Frodsham Jeff and Frodsham Justina
Current Estimated Value
Home Financials for this Owner
Home Financials are based on the most recent Mortgage that was taken out on this home.
Original Mortgage
$116,400
Outstanding Balance
$96,969
Interest Rate
3.9%
Mortgage Type
New Conventional
Estimated Equity
$162,621
Purchase Details
Closed on
Oct 18, 2012
Sold by
Roylance Michael
Bought by
Rincon Alejandro
Home Financials for this Owner
Home Financials are based on the most recent Mortgage that was taken out on this home.
Original Mortgage
$84,932
Interest Rate
3.25%
Mortgage Type
FHA
Purchase Details
Closed on
May 4, 2010
Sold by
Raehl Aaron Daniel and Raehl Erin Elizabeth
Bought by
Roylance Michael
Home Financials for this Owner
Home Financials are based on the most recent Mortgage that was taken out on this home.
Original Mortgage
$5,558
Interest Rate
5.04%
Mortgage Type
Stand Alone Second
Create a Home Valuation Report for This Property
The Home Valuation Report is an in-depth analysis detailing your home's value as well as a comparison with similar homes in the area
Home Values in the Area
Average Home Value in this Area
Purchase History
| Date | Buyer | Sale Price | Title Company |
|---|---|---|---|
| Frodsham Jeff | -- | None Available | |
| Rincon Alejandro | -- | Hickman Land Title Company | |
| Roylance Michael | -- | Advanced Title |
Source: Public Records
Mortgage History
| Date | Status | Borrower | Loan Amount |
|---|---|---|---|
| Open | Frodsham Jeff | $116,400 | |
| Previous Owner | Rincon Alejandro | $84,932 | |
| Previous Owner | Roylance Michael | $5,558 | |
| Previous Owner | Roylance Michael | $94,724 |
Source: Public Records
Tax History Compared to Growth
Tax History
| Year | Tax Paid | Tax Assessment Tax Assessment Total Assessment is a certain percentage of the fair market value that is determined by local assessors to be the total taxable value of land and additions on the property. | Land | Improvement |
|---|---|---|---|---|
| 2025 | $1,069 | $138,230 | $0 | $0 |
| 2024 | $1,109 | $138,915 | $0 | $0 |
| 2023 | $1,233 | $147,180 | $0 | $0 |
| 2022 | $1,357 | $151,250 | $0 | $0 |
| 2021 | $1,155 | $198,890 | $50,000 | $148,890 |
| 2020 | $997 | $154,600 | $30,000 | $124,600 |
| 2019 | $925 | $137,272 | $30,000 | $107,272 |
| 2018 | $910 | $123,280 | $30,000 | $93,280 |
| 2017 | $805 | $57,640 | $0 | $0 |
| 2016 | $835 | $47,905 | $0 | $0 |
| 2015 | $692 | $47,745 | $0 | $0 |
| 2014 | $626 | $47,745 | $0 | $0 |
| 2013 | -- | $47,745 | $0 | $0 |
Source: Public Records
Map
Nearby Homes
- 168 W 1275 S
- 130 W 1260 S
- 593 W 300 S
- 475 W 60 S Unit L304
- 460 W 15 S Unit G202
- 470 W 15 S Unit F301
- 460 W 15 S Unit G201
- 460 W 15 S Unit G301
- 462 W 40 S Unit 202
- 268 W 1030 S
- 427 W 65 S
- 426 W 15 S
- 238 W 1010 S Unit 43
- 273 W 1010 S
- 265 W 1010 S
- 233 W 1010 S
- 866 Riverwood Dr
- 439 Meadow Ln
- 287 S 375 W
- 600 W 300 S