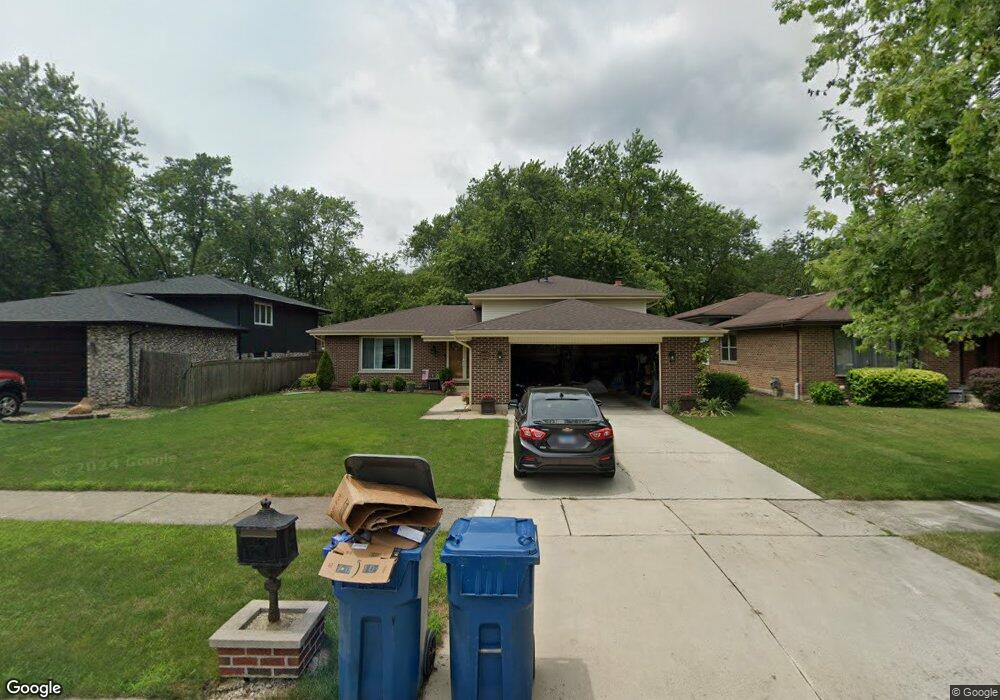
14404 Maple Ln Midlothian, IL 60445
Estimated Value: $271,070 - $340,000
3
Beds
2
Baths
1,392
Sq Ft
$224/Sq Ft
Est. Value
About This Home
This home is located at 14404 Maple Ln, Midlothian, IL 60445 and is currently estimated at $311,518, approximately $223 per square foot. 14404 Maple Ln is a home located in Cook County with nearby schools including Kerkstra Elementary School, Jack Hille Middle School, and Oak Forest High School.
Ownership History
Date
Name
Owned For
Owner Type
Purchase Details
Closed on
Apr 16, 2008
Sold by
Johnson Linda F and Johnson Jessie G
Bought by
Bille Scott M and Bille Kelli R
Current Estimated Value
Home Financials for this Owner
Home Financials are based on the most recent Mortgage that was taken out on this home.
Original Mortgage
$223,200
Outstanding Balance
$138,819
Interest Rate
5.88%
Mortgage Type
Unknown
Estimated Equity
$172,699
Purchase Details
Closed on
Nov 7, 1994
Sold by
Kramer John R and Kramer Deborah A
Bought by
Johnson Jessie G and Johnson Linda F
Home Financials for this Owner
Home Financials are based on the most recent Mortgage that was taken out on this home.
Original Mortgage
$101,900
Interest Rate
8.86%
Create a Home Valuation Report for This Property
The Home Valuation Report is an in-depth analysis detailing your home's value as well as a comparison with similar homes in the area
Home Values in the Area
Average Home Value in this Area
Purchase History
| Date | Buyer | Sale Price | Title Company |
|---|---|---|---|
| Bille Scott M | $248,000 | Multiple | |
| Johnson Jessie G | $150,000 | Attorneys Natl Title Network |
Source: Public Records
Mortgage History
| Date | Status | Borrower | Loan Amount |
|---|---|---|---|
| Open | Bille Scott M | $223,200 | |
| Previous Owner | Johnson Jessie G | $101,900 |
Source: Public Records
Tax History
| Year | Tax Paid | Tax Assessment Tax Assessment Total Assessment is a certain percentage of the fair market value that is determined by local assessors to be the total taxable value of land and additions on the property. | Land | Improvement |
|---|---|---|---|---|
| 2025 | $6,287 | $20,843 | $3,888 | $16,955 |
| 2024 | $6,287 | $20,843 | $3,888 | $16,955 |
| 2023 | $5,297 | $20,843 | $3,888 | $16,955 |
| 2022 | $5,297 | $14,843 | $3,888 | $10,955 |
| 2021 | $5,188 | $14,843 | $3,888 | $10,955 |
| 2020 | $5,072 | $14,843 | $3,888 | $10,955 |
| 2019 | $7,717 | $21,156 | $3,645 | $17,511 |
| 2018 | $7,560 | $21,156 | $3,645 | $17,511 |
| 2017 | $7,351 | $21,156 | $3,645 | $17,511 |
| 2016 | $6,142 | $16,828 | $3,159 | $13,669 |
| 2015 | $5,949 | $16,828 | $3,159 | $13,669 |
| 2014 | $5,793 | $16,828 | $3,159 | $13,669 |
| 2013 | $6,855 | $21,598 | $3,159 | $18,439 |
Source: Public Records
Map
Nearby Homes
- 14501 Central Ct Unit PH3
- 14511 Central Ct Unit M2
- 14222 Long Ave
- 14517 Sussex Ct Unit PH-1
- 14601 Linder Ave
- 14529 Walden Ct Unit M3
- 14533 Walden Ct Unit G2
- 14708 El Vista Ave
- 5202 Midlothian Turnpike Unit 107
- 13933 James Dr Unit 822
- 14852 Park Ave
- 14725 Laramie Ave
- 5321 Waterbury Dr Unit 502
- 13911 James Dr Unit 1005
- 14015 Laramie Ave Unit 316
- 4948 145th St
- 13911 Laramie Ave Unit 122
- 14641 Lavergne Ave
- 15020 Park Ave
- 14411 Lamon Ave
- 14358 Maple Ln
- 14410 Maple Ln
- 14346 Maple Ln
- 14412 Maple Ln
- 14405 Central Ave
- 14359 Central Ave
- 14409 Central Ave
- 14340 Maple Ln
- 14345 Central Ave
- 14411 Central Ave
- 14359 Maple Ln
- 14405 Maple Ln
- 14341 Central Ave
- 14345 Maple Ln
- 14336 Maple Ln
- 14409 Maple Ln
- 14341 Maple Ln
- 14325 Central Ave
- 14411 Maple Ln
- 5547 Maple Ln
Your Personal Tour Guide
Ask me questions while you tour the home.