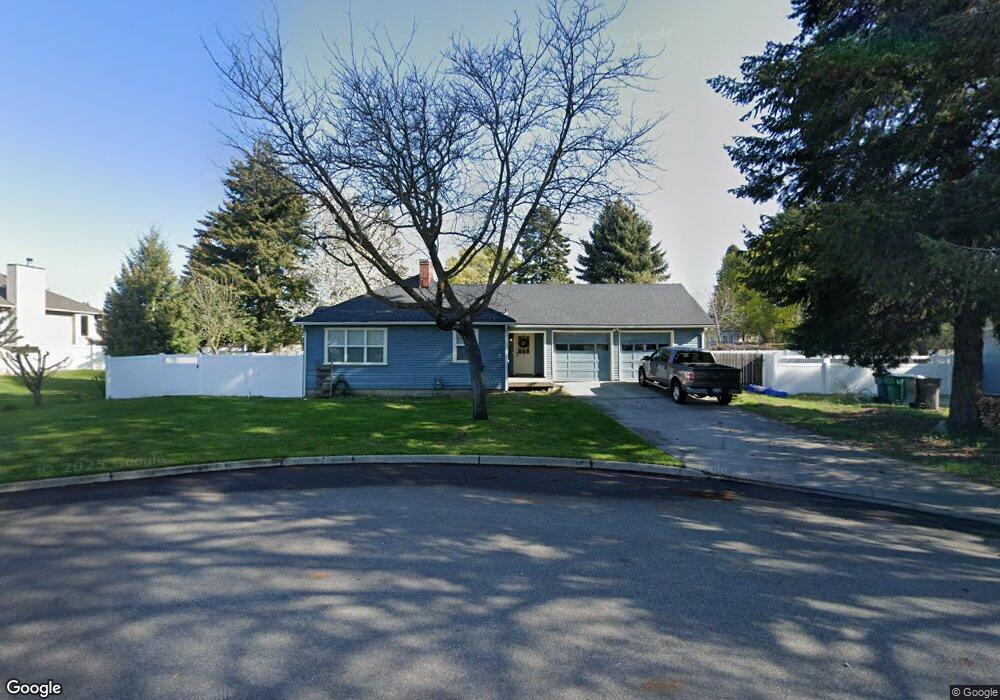
14407 E Nixon Ave Spokane Valley, WA 99216
Estimated Value: $384,000 - $420,000
3
Beds
2
Baths
1,102
Sq Ft
$362/Sq Ft
Est. Value
About This Home
This home is located at 14407 E Nixon Ave, Spokane Valley, WA 99216 and is currently estimated at $398,549, approximately $361 per square foot. 14407 E Nixon Ave is a home located in Spokane County with nearby schools including Progress Elementary School, North Pines Middle School, and Central Valley High School.
Ownership History
Date
Name
Owned For
Owner Type
Purchase Details
Closed on
Aug 25, 2014
Sold by
Gochnauer Cynthia G
Bought by
Mayhew Kenneth R and Mayhew Lexi C
Current Estimated Value
Home Financials for this Owner
Home Financials are based on the most recent Mortgage that was taken out on this home.
Original Mortgage
$134,027
Outstanding Balance
$102,493
Interest Rate
4.11%
Mortgage Type
FHA
Estimated Equity
$296,056
Purchase Details
Closed on
Aug 18, 1999
Sold by
Dionne Cindy L and Coats Cindy L
Bought by
Gochnauer Cynthia G
Home Financials for this Owner
Home Financials are based on the most recent Mortgage that was taken out on this home.
Original Mortgage
$93,350
Interest Rate
7.63%
Purchase Details
Closed on
Apr 6, 1998
Sold by
Coats Phillip E
Bought by
Coats Cindy L
Create a Home Valuation Report for This Property
The Home Valuation Report is an in-depth analysis detailing your home's value as well as a comparison with similar homes in the area
Home Values in the Area
Average Home Value in this Area
Purchase History
| Date | Buyer | Sale Price | Title Company |
|---|---|---|---|
| Mayhew Kenneth R | $136,500 | First American Title Ins Co | |
| Gochnauer Cynthia G | $98,300 | Transnation Title Ins Co | |
| Coats Cindy L | -- | -- |
Source: Public Records
Mortgage History
| Date | Status | Borrower | Loan Amount |
|---|---|---|---|
| Open | Mayhew Kenneth R | $134,027 | |
| Previous Owner | Gochnauer Cynthia G | $93,350 |
Source: Public Records
Tax History Compared to Growth
Tax History
| Year | Tax Paid | Tax Assessment Tax Assessment Total Assessment is a certain percentage of the fair market value that is determined by local assessors to be the total taxable value of land and additions on the property. | Land | Improvement |
|---|---|---|---|---|
| 2025 | $3,593 | $340,300 | $95,000 | $245,300 |
| 2024 | $3,593 | $335,900 | $85,000 | $250,900 |
| 2023 | $3,054 | $330,900 | $80,000 | $250,900 |
| 2022 | $2,934 | $317,700 | $65,000 | $252,700 |
| 2021 | $2,740 | $219,000 | $42,500 | $176,500 |
| 2020 | $2,353 | $190,600 | $38,000 | $152,600 |
| 2019 | $2,055 | $173,700 | $34,000 | $139,700 |
| 2018 | $2,282 | $160,500 | $34,000 | $126,500 |
| 2017 | $2,042 | $146,000 | $34,000 | $112,000 |
| 2016 | $1,948 | $134,900 | $32,000 | $102,900 |
| 2015 | $1,894 | $128,800 | $32,000 | $96,800 |
| 2014 | -- | $124,300 | $30,000 | $94,300 |
| 2013 | -- | $0 | $0 | $0 |
Source: Public Records
Map
Nearby Homes
- 12323 E Riverside Ave
- 14908 E Sprague Ave Unit 21
- 1428 S Vera Crest Dr
- 404 S Reese Ln
- 1027 N Marcus Ln
- 1123 N Marcus Ln
- 15111 E Mallon Ave
- 13405 E Sprague Ave Unit B103
- 315 N Mccabe Rd
- 14503 E 8th Ave
- 908 N Ravalli Ct
- 14825 E Mission Ave Unit 14827 E Mission Ave
- 905 N Ravalli Dr
- 13222 E Nixon Ave
- 628 S Evergreen Rd
- 14321 E Mission Ave Unit 14323
- 108 N Clinton Rd
- 13513 E Cataldo Ln
- 1221 N Mamer Rd
- 13217 E 3rd Ln
- 14401 E Nixon Ave
- 14402 E Nixon Ave
- 14329 E Nixon Ave
- 14413 E Nixon Ave
- 14523 E Nixon Ave
- 14408 E Nixon Ave
- 14408 E Valleyway Ave
- 14328 E Nixon Ave
- 227 N Calvin Rd
- 14404 E Valleyway Ave
- 14412 E Valleyway Ave
- 14421 E Nixon Ave
- 14325 E Nixon Ave
- 14324 E Nixon Ave
- 223 N Calvin Rd
- 14324 E Valleyway Ave
- 14504 E Valleyway Ave
- 14503 E Nixon Ave
- 318 N Best Rd
- 14407 E Main Ave