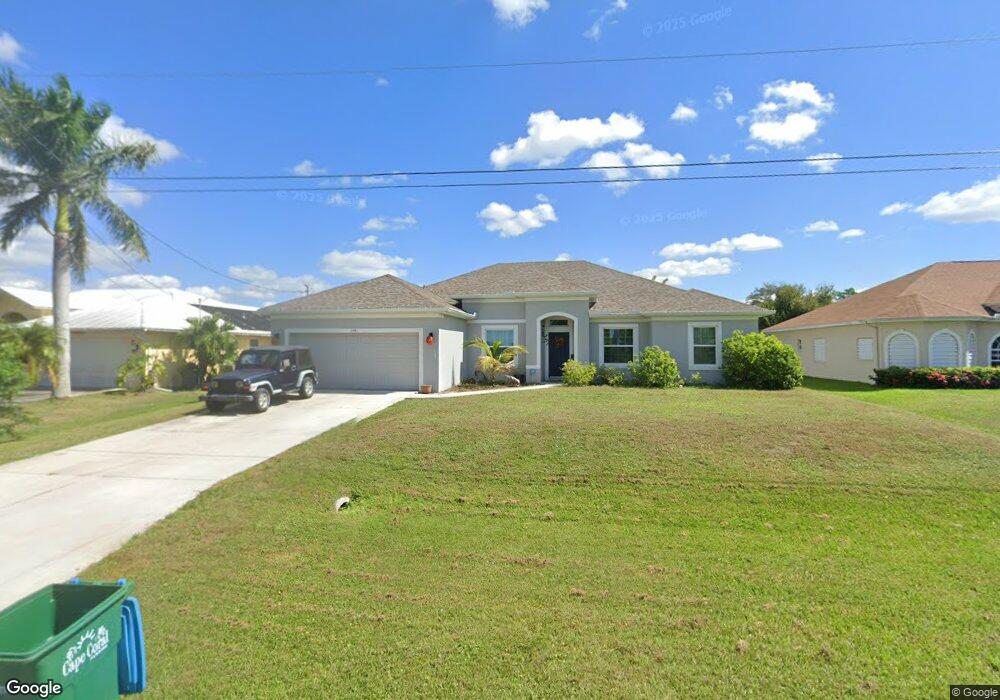
1441 NW 29th Place Cape Coral, FL 33993
Burnt Store NeighborhoodEstimated Value: $380,127 - $502,000
4
Beds
3
Baths
2,499
Sq Ft
$185/Sq Ft
Est. Value
About This Home
This home is located at 1441 NW 29th Place, Cape Coral, FL 33993 and is currently estimated at $461,782, approximately $184 per square foot. 1441 NW 29th Place is a home located in Lee County with nearby schools including Dr. Carrie D. Robinson Littleton Elementary School, Caloosa Elementary School, and Tropic Isles Elementary School.
Ownership History
Date
Name
Owned For
Owner Type
Purchase Details
Closed on
Sep 28, 2018
Sold by
Holiday Builders Inc
Bought by
Lianes Adrian E and Lianes Christi L
Current Estimated Value
Home Financials for this Owner
Home Financials are based on the most recent Mortgage that was taken out on this home.
Original Mortgage
$261,611
Outstanding Balance
$227,670
Interest Rate
4.5%
Mortgage Type
New Conventional
Estimated Equity
$234,112
Purchase Details
Closed on
Nov 28, 2016
Sold by
Musone Angelo and Musone Jaqueline
Bought by
Holiday Builders Inc
Purchase Details
Closed on
Jun 19, 2003
Sold by
Calamela Anthony
Bought by
Musone Angelo and Musone Jacqueline
Purchase Details
Closed on
Jun 5, 2003
Sold by
Heggemeier Gary and Heggermeier Joan D
Bought by
Calamela Anthony
Purchase Details
Closed on
Feb 15, 2002
Sold by
Heggemeier Gary and Meggemeier Joan D
Bought by
Calamela Anthony
Create a Home Valuation Report for This Property
The Home Valuation Report is an in-depth analysis detailing your home's value as well as a comparison with similar homes in the area
Home Values in the Area
Average Home Value in this Area
Purchase History
| Date | Buyer | Sale Price | Title Company |
|---|---|---|---|
| Lianes Adrian E | $290,700 | Hb Title Inc | |
| Holiday Builders Inc | $33,200 | Hb Title Inc | |
| Musone Angelo | $50,400 | -- | |
| Calamela Anthony | -- | -- | |
| Calamela Anthony | -- | -- |
Source: Public Records
Mortgage History
| Date | Status | Borrower | Loan Amount |
|---|---|---|---|
| Open | Lianes Adrian E | $261,611 |
Source: Public Records
Tax History Compared to Growth
Tax History
| Year | Tax Paid | Tax Assessment Tax Assessment Total Assessment is a certain percentage of the fair market value that is determined by local assessors to be the total taxable value of land and additions on the property. | Land | Improvement |
|---|---|---|---|---|
| 2025 | $5,848 | $342,379 | $60,563 | $281,816 |
| 2024 | $6,415 | $354,642 | $58,104 | $296,538 |
| 2023 | $6,415 | $315,548 | $0 | $0 |
| 2022 | $5,796 | $286,862 | $0 | $0 |
| 2021 | $5,158 | $260,784 | $28,000 | $232,784 |
| 2020 | $5,024 | $243,863 | $31,000 | $212,863 |
| 2019 | $4,628 | $223,660 | $25,000 | $198,660 |
| 2018 | $711 | $25,000 | $25,000 | $0 |
| 2017 | $937 | $34,965 | $34,965 | $0 |
| 2016 | $669 | $24,000 | $24,000 | $0 |
| 2015 | $634 | $24,000 | $24,000 | $0 |
| 2014 | -- | $21,160 | $21,160 | $0 |
| 2013 | -- | $15,300 | $15,300 | $0 |
Source: Public Records
Map
Nearby Homes
- 2903 Diplomat Pkwy W
- 1135 NW 28th Place
- 1154 NW 28th Ave
- 1146 NW 28th Ave
- 2613 NW 28th Ave
- 1124 NW 28th Ave
- 1153 NW 28th Ave
- 1532 NW 28th Ave
- 1108 NW 28th Ave
- 2925 Diplomat Pkwy W
- 1437 NW 31st Ave
- 2810 Diplomat Pkwy W
- 1424 NW 31st Ave
- 1600 NW 31st Ave
- 1626 NW 31st Ave
- 1511 NW 27th Place
- 2700 NW 14th Terrace
- 1425 NW 31st Place
- 2625 NW 14th Terrace
- 1507 NW 27th Place
- 1445 NW 29th Place
- 1437 NW 29th Place
- 1503 NW 29th Place
- 1433 NW 29th Place
- 1444 NW 29th Place
- 1507 NW 29th Place
- 1502 NW 29th Place
- 1429 NW 29th Place
- 3002 NW 11th Terrace
- 1506 NW 29th Place
- 1428 NW 29th Place
- 1511 NW 29th Place
- 1425 NW 29th Place
- 2835 NW 14th Terrace
- 1510 NW 29th Place
- 1424 NW 29th Place
- 2822 NW 15th St
- 2819 NW 15th St
- 2827 NW 14th Terrace