Estimated Value: $200,691 - $223,000
2
Beds
3
Baths
1,605
Sq Ft
$129/Sq Ft
Est. Value
About This Home
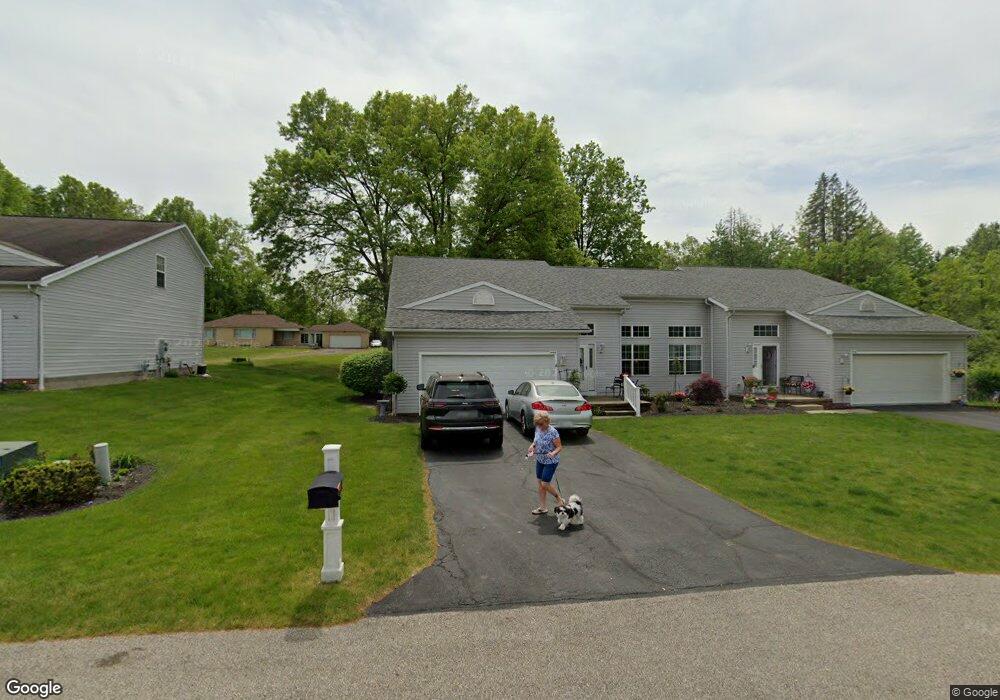
This home is located at 1441 Shaw Rd, Niles, OH 44446 and is currently estimated at $207,673, approximately $129 per square foot. 1441 Shaw Rd is a home located in Trumbull County with nearby schools including Niles Primary School, Niles Intermediate School, and Niles Middle School.
Ownership History
Date
Name
Owned For
Owner Type
Purchase Details
Closed on
Jul 30, 2025
Sold by
Bock Bonnie L
Bought by
Anerino Gregory and Anerino Barbara
Current Estimated Value
Purchase Details
Closed on
Nov 5, 2015
Sold by
Pmd Land Company Ltd
Bought by
Bock Bonnie L
Home Financials for this Owner
Home Financials are based on the most recent Mortgage that was taken out on this home.
Interest Rate
3.87%
Purchase Details
Closed on
Aug 7, 2009
Sold by
Tober Duane C and Tober Jennifer L
Bought by
Pmd Land Company Ltd
Purchase Details
Closed on
Aug 8, 2008
Sold by
Pmd Land Co Ltd
Bought by
Tober Jennifer L and Tober Duane C
Home Financials for this Owner
Home Financials are based on the most recent Mortgage that was taken out on this home.
Original Mortgage
$101,000
Interest Rate
6.51%
Mortgage Type
Purchase Money Mortgage
Purchase Details
Closed on
Jun 12, 2001
Sold by
Sheriff Trumbull Cty
Bought by
Pmd Land Company
Create a Home Valuation Report for This Property
The Home Valuation Report is an in-depth analysis detailing your home's value as well as a comparison with similar homes in the area
Home Values in the Area
Average Home Value in this Area
Purchase History
| Date | Buyer | Sale Price | Title Company |
|---|---|---|---|
| Anerino Gregory | $200,000 | American Title | |
| Bock Bonnie L | $86,900 | -- | |
| Pmd Land Company Ltd | -- | The Title Co Of Warren Agenc | |
| Tober Jennifer L | $117,500 | Attorney | |
| Pmd Land Company | $422,666 | -- |
Source: Public Records
Mortgage History
| Date | Status | Borrower | Loan Amount |
|---|---|---|---|
| Previous Owner | Pmd Land Company | -- | |
| Previous Owner | Tober Jennifer L | $101,000 |
Source: Public Records
Tax History
| Year | Tax Paid | Tax Assessment Tax Assessment Total Assessment is a certain percentage of the fair market value that is determined by local assessors to be the total taxable value of land and additions on the property. | Land | Improvement |
|---|---|---|---|---|
| 2024 | $1,636 | $38,150 | $3,500 | $34,650 |
| 2023 | $1,636 | $38,150 | $3,500 | $34,650 |
| 2022 | $1,945 | $38,750 | $3,500 | $35,250 |
| 2021 | $2,043 | $38,750 | $3,500 | $35,250 |
| 2020 | $2,062 | $38,750 | $3,500 | $35,250 |
| 2019 | $2,166 | $38,750 | $3,500 | $35,250 |
| 2018 | $2,159 | $38,750 | $3,500 | $35,250 |
| 2017 | $2,147 | $38,750 | $3,500 | $35,250 |
| 2016 | $1,903 | $34,020 | $3,500 | $30,520 |
| 2015 | $1,883 | $34,020 | $3,500 | $30,520 |
| 2014 | $1,890 | $34,020 | $3,500 | $30,520 |
| 2013 | $2,010 | $38,190 | $3,500 | $34,690 |
Source: Public Records
Map
Nearby Homes
- 1414 Niles Cortland Rd
- 1486 Tripodi Cir
- 745 Youngstown Warren Rd
- 2564 Niles Cortland Rd SE
- 1317 Hartzell Ave
- 1004 N Bentley Ave
- 924 Nob Hill Dr Unit 3
- 47 Woodland Chase Blvd Unit 47
- 1710 Difford Dr
- 820 Hartzell Ave
- 812 Hartzell Ave
- 0 Hughes St SE
- 340 Mcevoy Ct
- 7631 Mines Rd SE
- 352 N Rhodes Ave
- 504 Lincoln Ave
- 520 Washington Ave
- 404 N Bentley Ave
- 1443 Youll St
- 2520 Eastpoint Heights Dr SE
- 1441 Shaw Rd
- 1441 Shaw Rd Unit B
- 1441 Shaw Rd Unit A
- 1439 Shaw Rd
- 1439 Shaw Rd
- 1439 Shaw Rd Unit B
- 1439 Shaw Rd Unit A
- 1431 Shaw Rd
- 1431 Shaw Rd Unit A
- 1431 Shaw Rd Unit B
- 1433 Shaw Rd
- 1433 Shaw Rd
- 1433 Shaw Rd Unit B
- 1433 Shaw Rd Unit A
- 1531 Shaw Rd
- 1531 Shaw Rd
- 1437 Shaw Rd
- 1437 Shaw Rd
- 1437 Shaw Rd Unit A
- 1443 Shaw Rd
Your Personal Tour Guide
Ask me questions while you tour the home.