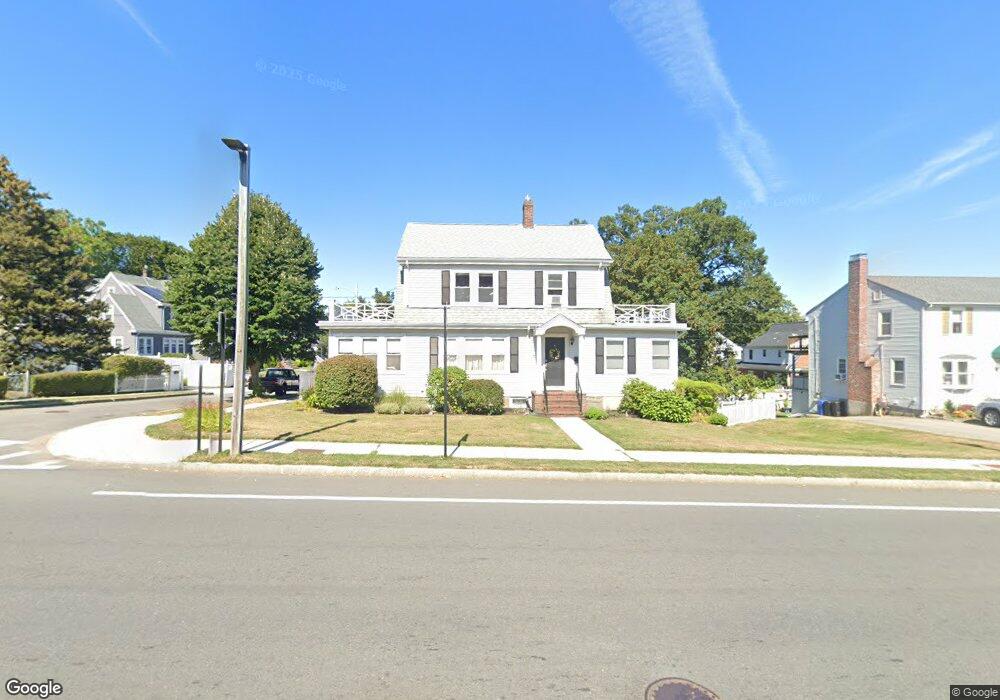
1442 Quincy Shore Dr Quincy, MA 02169
Merrymount NeighborhoodEstimated Value: $767,938 - $849,000
3
Beds
2
Baths
1,554
Sq Ft
$516/Sq Ft
Est. Value
About This Home
This home is located at 1442 Quincy Shore Dr, Quincy, MA 02169 and is currently estimated at $801,985, approximately $516 per square foot. 1442 Quincy Shore Dr is a home located in Norfolk County with nearby schools including Merrymount Elementary School, Central Middle School, and Quincy High School.
Ownership History
Date
Name
Owned For
Owner Type
Purchase Details
Closed on
Jun 6, 2018
Sold by
Rooney Edward C and Rooney Mary F
Bought by
Rooney Ft
Current Estimated Value
Create a Home Valuation Report for This Property
The Home Valuation Report is an in-depth analysis detailing your home's value as well as a comparison with similar homes in the area
Home Values in the Area
Average Home Value in this Area
Purchase History
| Date | Buyer | Sale Price | Title Company |
|---|---|---|---|
| Rooney Ft | -- | -- |
Source: Public Records
Tax History Compared to Growth
Tax History
| Year | Tax Paid | Tax Assessment Tax Assessment Total Assessment is a certain percentage of the fair market value that is determined by local assessors to be the total taxable value of land and additions on the property. | Land | Improvement |
|---|---|---|---|---|
| 2025 | $8,073 | $700,200 | $330,700 | $369,500 |
| 2024 | $7,701 | $683,300 | $321,200 | $362,100 |
| 2023 | $6,858 | $616,200 | $279,500 | $336,700 |
| 2022 | $6,826 | $569,800 | $254,400 | $315,400 |
| 2021 | $6,787 | $559,100 | $254,400 | $304,700 |
| 2020 | $5,953 | $478,900 | $195,700 | $283,200 |
| 2019 | $5,684 | $452,900 | $183,000 | $269,900 |
| 2018 | $5,235 | $392,400 | $169,400 | $223,000 |
| 2017 | $5,263 | $371,400 | $169,400 | $202,000 |
| 2016 | $5,250 | $365,600 | $177,300 | $188,300 |
| 2015 | $5,047 | $345,700 | $173,100 | $172,600 |
| 2014 | $4,763 | $320,500 | $161,400 | $159,100 |
Source: Public Records
Map
Nearby Homes
- 1421 Quincy Shore Dr
- 1427 Quincy Shore Dr
- 188 Samoset Ave
- 105 Sea St Unit 301
- 105 Sea St Unit 203
- 105 Sea St Unit 105
- 37 Hobomack Rd
- 74 Butler Rd
- 20 Putnam St
- 20 Whitney Rd Unit 1
- 73 Albatross Rd
- 66 Mcgrath Hwy Unit 407
- 66 Mcgrath Hwy Unit 405
- 66 Mcgrath Hwy Unit 308
- 66 Mcgrath Hwy Unit 303
- 66 Mcgrath Hwy Unit 508
- 59 Spear St Unit 302
- 59 Spear St Unit 301
- 59 Spear St Unit 202
- 100 Thornton St
- 11 Pontiac Rd
- 1450 Quincy Shore Dr
- 1450 Quincy Shore Dr Unit 1
- 15 Pontiac Rd
- 156 Sea St
- 1443 Quincy Shore Dr
- 4 Pontiac Rd
- 19 Pontiac Rd
- 10 Pontiac Rd
- 14 Pontiac Rd
- 1453 Quincy Shore Dr
- 1428 Quincy Shore Dr
- 18 Pontiac Rd
- 21 Pontiac Rd
- 1433 Quincy Shore Dr
- 1441 Quincy Shore Dr
- 164 Sea St
- 151 Sea St Unit 505
- 151 Sea St
- 151 Sea St