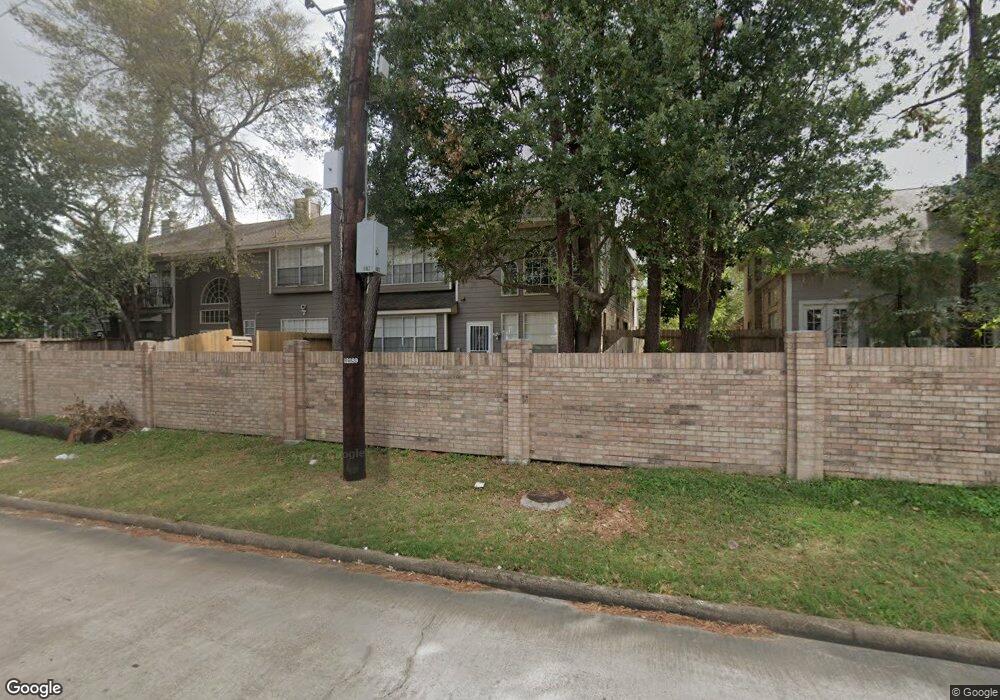
14420 Walters Rd Unit 17 Houston, TX 77014
Northside NeighborhoodEstimated Value: $223,699 - $240,000
3
Beds
3
Baths
1,959
Sq Ft
$119/Sq Ft
Est. Value
About This Home
This home is located at 14420 Walters Rd Unit 17, Houston, TX 77014 and is currently estimated at $233,675, approximately $119 per square foot. 14420 Walters Rd Unit 17 is a home located in Harris County with nearby schools including Pat Reynolds Elementary School, Edwin M. Wells Middle School, and Westfield High School.
Ownership History
Date
Name
Owned For
Owner Type
Purchase Details
Closed on
Dec 12, 2013
Sold by
Chang Hao Wen and Huang Hsui Yu
Bought by
Abercrombie Ella F
Current Estimated Value
Home Financials for this Owner
Home Financials are based on the most recent Mortgage that was taken out on this home.
Original Mortgage
$107,908
Outstanding Balance
$81,160
Interest Rate
4.37%
Mortgage Type
FHA
Estimated Equity
$152,515
Purchase Details
Closed on
Jan 30, 2002
Sold by
Arteaga Maria Julia Ransanz
Bought by
Chang Hao Wen and Huang Hsiu Yu
Home Financials for this Owner
Home Financials are based on the most recent Mortgage that was taken out on this home.
Original Mortgage
$131,000
Interest Rate
7.15%
Mortgage Type
Stand Alone First
Create a Home Valuation Report for This Property
The Home Valuation Report is an in-depth analysis detailing your home's value as well as a comparison with similar homes in the area
Home Values in the Area
Average Home Value in this Area
Purchase History
| Date | Buyer | Sale Price | Title Company |
|---|---|---|---|
| Abercrombie Ella F | -- | Universal Title Partners | |
| Chang Hao Wen | -- | Chicago Title Insurance Co |
Source: Public Records
Mortgage History
| Date | Status | Borrower | Loan Amount |
|---|---|---|---|
| Open | Abercrombie Ella F | $107,908 | |
| Previous Owner | Chang Hao Wen | $131,000 |
Source: Public Records
Tax History Compared to Growth
Tax History
| Year | Tax Paid | Tax Assessment Tax Assessment Total Assessment is a certain percentage of the fair market value that is determined by local assessors to be the total taxable value of land and additions on the property. | Land | Improvement |
|---|---|---|---|---|
| 2025 | $1,290 | $241,550 | $40,209 | $201,341 |
| 2024 | $1,290 | $244,426 | $40,209 | $204,217 |
| 2023 | $1,290 | $182,558 | $32,987 | $149,571 |
| 2022 | $4,665 | $187,269 | $19,404 | $167,865 |
| 2021 | $4,458 | $167,654 | $19,404 | $148,250 |
| 2020 | $4,475 | $159,017 | $19,404 | $139,613 |
| 2019 | $4,226 | $144,314 | $19,404 | $124,910 |
| 2018 | $3,374 | $136,706 | $19,404 | $117,302 |
| 2017 | $3,906 | $136,706 | $19,404 | $117,302 |
| 2016 | $3,551 | $119,444 | $19,404 | $100,040 |
| 2015 | $3,288 | $119,444 | $19,404 | $100,040 |
| 2014 | $3,288 | $109,010 | $19,404 | $89,606 |
Source: Public Records
Map
Nearby Homes
- 14420 Walters Rd Unit 57
- 14420 Walters Rd Unit 68
- 14420 Walters Rd Unit 58
- 3770 Lovers Wood Ln Unit 1001
- 3770 Lovers Wood Ln Unit 904
- 3770 Lovers Wood Ln Unit 1010
- 3770 Lovers Wood Ln Unit 1006
- 3227 Atherton Canyon Ln
- 14319 Mirkwood Ln
- 14803 Forest Enclave Ln
- 14326 Mirkwood Ln
- 14907 Walters Rd
- 14911 Walters Rd
- 3014 Loganberry Park Ln
- 3811 Stableridge Dr
- 2911 Hackamore Hollow Ln
- 14914 Forest Enclave Ln
- 14326 Torrey Vista Dr
- 3307 Manor Tree Ln
- 3310 Manor Tree Ln
- 14420 Walters Rd Unit 67
- 14420 Walters Rd Unit 43
- 14420 Walters Rd Unit 7
- 14420 Walters Rd Unit 25
- 14420 Walters Rd Unit 1
- 14420 Walters Rd Unit 12
- 14420 Walters Rd Unit 28
- 14420 Walters Rd Unit 40
- 14420 Walters Rd Unit 60
- 14420 Walters Rd Unit 32
- 14420 Walters Rd Unit 15
- 14420 Walters Rd Unit 29
- 14420 Walters Rd Unit 10
- 14420 Walters Rd Unit 26
- 14420 Walters Rd Unit 19
- 14420 Walters Rd Unit 65
- 14420 Walters Rd Unit 36
- 14420 Walters Rd Unit 66
- 14420 Walters Rd Unit 52
- 14420 Walters Rd Unit 11