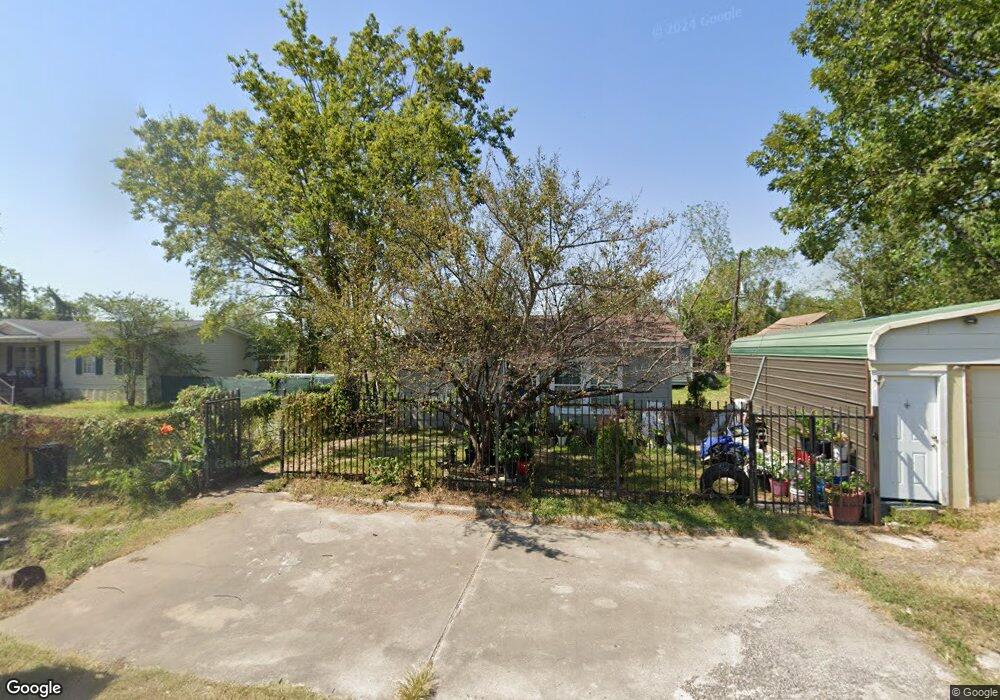
14421 Maeline St Houston, TX 77039
East Aldine NeighborhoodEstimated Value: $128,062 - $238,000
4
Beds
3
Baths
904
Sq Ft
$215/Sq Ft
Est. Value
About This Home
This home is located at 14421 Maeline St, Houston, TX 77039 and is currently estimated at $194,266, approximately $214 per square foot. 14421 Maeline St is a home located in Harris County with nearby schools including Calvert Elementary School, Aldine Middle School, and Macarthur Ninth Grade School.
Ownership History
Date
Name
Owned For
Owner Type
Purchase Details
Closed on
Apr 1, 2005
Sold by
Patella John B and Patella Evelyn L
Bought by
Deras Ovidio Alexander
Current Estimated Value
Home Financials for this Owner
Home Financials are based on the most recent Mortgage that was taken out on this home.
Original Mortgage
$55,000
Interest Rate
5.75%
Mortgage Type
Seller Take Back
Purchase Details
Closed on
Oct 28, 2004
Sold by
Patella John B and Patella Evelyn
Bought by
Patella John B and Patella Evelyn
Purchase Details
Closed on
Oct 2, 2002
Sold by
Herrera Teresa
Bought by
Patella John B and Patella Evelyn L
Purchase Details
Closed on
Aug 1, 2000
Sold by
Patella John B and Patella Evelyn L
Bought by
Herrera Teresa
Home Financials for this Owner
Home Financials are based on the most recent Mortgage that was taken out on this home.
Original Mortgage
$20,000
Interest Rate
7.1%
Mortgage Type
Seller Take Back
Create a Home Valuation Report for This Property
The Home Valuation Report is an in-depth analysis detailing your home's value as well as a comparison with similar homes in the area
Home Values in the Area
Average Home Value in this Area
Purchase History
| Date | Buyer | Sale Price | Title Company |
|---|---|---|---|
| Deras Ovidio Alexander | -- | -- | |
| Patella John B | -- | -- | |
| Patella John B | -- | -- | |
| Patella John B | -- | -- | |
| Herrera Teresa | -- | -- |
Source: Public Records
Mortgage History
| Date | Status | Borrower | Loan Amount |
|---|---|---|---|
| Closed | Deras Ovidio Alexander | $55,000 | |
| Previous Owner | Herrera Teresa | $20,000 |
Source: Public Records
Tax History Compared to Growth
Tax History
| Year | Tax Paid | Tax Assessment Tax Assessment Total Assessment is a certain percentage of the fair market value that is determined by local assessors to be the total taxable value of land and additions on the property. | Land | Improvement |
|---|---|---|---|---|
| 2025 | $508 | $96,972 | $28,739 | $68,233 |
| 2024 | $508 | $91,739 | $22,853 | $68,886 |
| 2023 | $508 | $91,739 | $22,853 | $68,886 |
| 2022 | $1,121 | $54,685 | $9,868 | $44,817 |
| 2021 | $1,178 | $54,685 | $9,660 | $45,025 |
| 2020 | $1,191 | $54,685 | $9,660 | $45,025 |
| 2019 | $989 | $41,572 | $9,660 | $31,912 |
| 2018 | $225 | $40,696 | $10,388 | $30,308 |
| 2017 | $1,126 | $49,665 | $10,388 | $39,277 |
| 2016 | $1,126 | $49,665 | $10,388 | $39,277 |
| 2015 | $845 | $49,665 | $10,388 | $39,277 |
| 2014 | $845 | $49,665 | $10,388 | $39,277 |
Source: Public Records
Map
Nearby Homes
- 14537 Maeline St
- 2127 Maximilian St Unit 10
- 2243 Matilda St
- 1826 Gault Rd
- 1916 Gault Rd
- 1631 Gault Rd
- 1725 Strawn Rd
- 1722 Strawn Rd
- 1718 W E Airtex Hardy E Airtex Rd
- 1730 Strawn Rd
- 1720 Strawn Rd
- 13917 Chrisman Rd
- 2434 Balmorhea Ave
- 2438 Balmorhea Ave
- 2807 Verhalen Ave
- 13920 Reeveston Rd
- 2611 Lauder Rd
- 2715 Toyah Ave
- 2703 Lauder Rd
- 2710 Woodgate St
- 14418 Aldine Westfield Rd
- 14418 Aldine Westfield Rd Unit 3
- 14428 Maeline St
- 14416 Aldine Westfield Rd
- 14424 Maeline St
- 2103 Maurine St
- 14437 Maeline St
- 0 Maurine St
- 2102 Molly St
- 2111 Maurine St
- 2102 Maurine St
- 14409 Maeline St
- 14400 Aldine Westfield Rd
- 2101 Maximilian St
- 2113 Maurine St
- 14501 Maeline St
- 2118 Maurine St
- 2103 Molly St
- 2107 Molly St
- 2119 Maximilian St