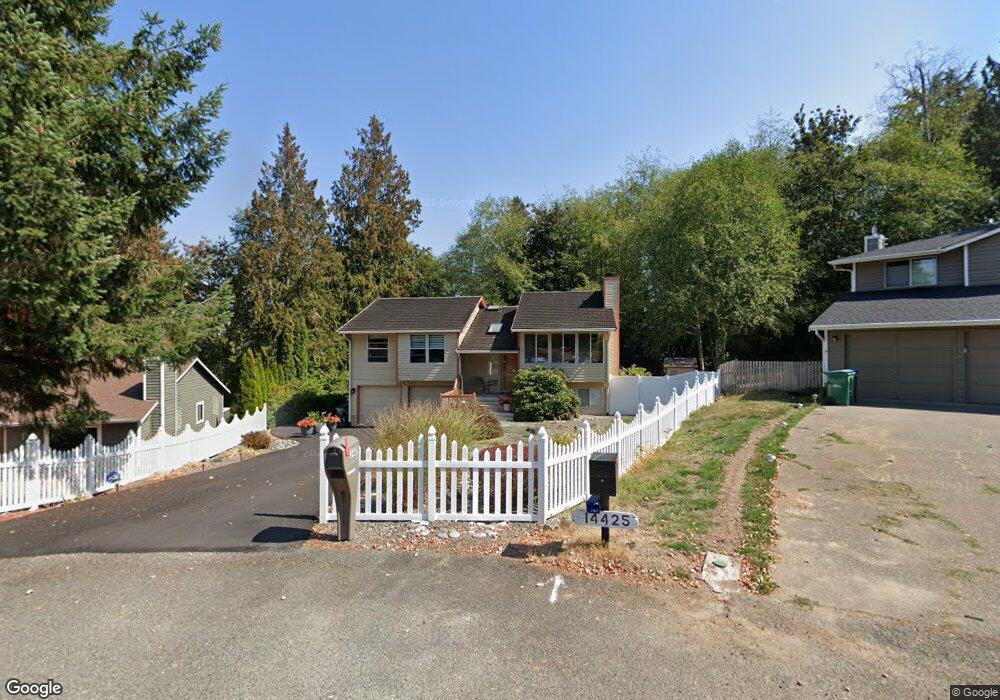
14424 Kestrel Place NE Poulsbo, WA 98370
Estimated Value: $573,000 - $645,000
4
Beds
4
Baths
1,322
Sq Ft
$451/Sq Ft
Est. Value
About This Home
This home is located at 14424 Kestrel Place NE, Poulsbo, WA 98370 and is currently estimated at $596,533, approximately $451 per square foot. 14424 Kestrel Place NE is a home located in Kitsap County with nearby schools including Hilder Pearson Elementary School, Poulsbo Middle School, and North Kitsap High School.
Ownership History
Date
Name
Owned For
Owner Type
Purchase Details
Closed on
Nov 13, 2000
Sold by
The Hornick Company Llc
Bought by
Norman James L and Norman Lynne L
Current Estimated Value
Home Financials for this Owner
Home Financials are based on the most recent Mortgage that was taken out on this home.
Original Mortgage
$126,000
Outstanding Balance
$46,230
Interest Rate
7.82%
Estimated Equity
$550,303
Purchase Details
Closed on
May 2, 2000
Sold by
Navy Federal Credit Union
Bought by
The Hornick Company Llc
Home Financials for this Owner
Home Financials are based on the most recent Mortgage that was taken out on this home.
Original Mortgage
$150,000
Interest Rate
8.22%
Purchase Details
Closed on
Apr 9, 1999
Sold by
Raboteau Keith G and Raboteau Jacqueline C
Bought by
Navy Fcu
Create a Home Valuation Report for This Property
The Home Valuation Report is an in-depth analysis detailing your home's value as well as a comparison with similar homes in the area
Home Values in the Area
Average Home Value in this Area
Purchase History
| Date | Buyer | Sale Price | Title Company |
|---|---|---|---|
| Norman James L | $170,000 | First American Title Ins | |
| The Hornick Company Llc | $129,000 | Pacific Nw Title | |
| Navy Fcu | $44,909 | First American Title Ins |
Source: Public Records
Mortgage History
| Date | Status | Borrower | Loan Amount |
|---|---|---|---|
| Open | Norman James L | $126,000 | |
| Previous Owner | The Hornick Company Llc | $150,000 |
Source: Public Records
Tax History Compared to Growth
Tax History
| Year | Tax Paid | Tax Assessment Tax Assessment Total Assessment is a certain percentage of the fair market value that is determined by local assessors to be the total taxable value of land and additions on the property. | Land | Improvement |
|---|---|---|---|---|
| 2026 | $4,845 | $534,580 | $100,640 | $433,940 |
| 2025 | $4,845 | $534,580 | $100,640 | $433,940 |
| 2024 | $4,390 | $499,130 | $102,860 | $396,270 |
| 2023 | $4,462 | $499,130 | $102,860 | $396,270 |
| 2022 | $3,789 | $400,400 | $85,710 | $314,690 |
| 2021 | $3,668 | $358,460 | $76,800 | $281,660 |
| 2020 | $3,570 | $343,380 | $73,370 | $270,010 |
| 2019 | $3,351 | $321,100 | $68,570 | $252,530 |
| 2018 | $3,053 | $246,540 | $57,140 | $189,400 |
| 2017 | $2,892 | $246,540 | $57,140 | $189,400 |
| 2016 | $2,903 | $228,200 | $57,140 | $171,060 |
| 2015 | $2,883 | $228,200 | $57,140 | $171,060 |
| 2014 | -- | $218,960 | $57,140 | $161,820 |
| 2013 | -- | $218,960 | $57,140 | $161,820 |
Source: Public Records
Map
Nearby Homes
- 1354 Hoffs Dr
- 1533 NE Tagholm Rd
- 2393 NE Trail Way
- 13423 Graywolf Place NE
- 1922 NE Fir St
- 1422 NW Swenson Ct
- 13977 Blackberry Ln NE
- 15485 NE Peterson Rd
- 1314 NE South Petterson Rd
- 1954 NE Grandview Blvd
- 0 NE Solar View Ct
- 15739 Virginia Loop Rd NE
- 0 S Keyport Rd NE
- 15809 Virginia Point Rd NE
- 2331 NE Toscana Way
- 2331 Lot C+D NE Toscana Way
- 13600 Hillcrest St NW
- 12301 Old Military Rd NE
- 1678 NE Jacobson Rd
- 0 xxxx Brownsville Hwy NE
- 14425 Kestrel Place NE
- 14430 Kestrel Place NE
- 14431 Kestrel Place NE
- 14437 Kestrel Place NE
- 14442 Kestrel Place NE
- 14462 Kestrel Place NE
- 14443 Kestrel Place NE
- 14512 Kestrel Place NE
- 14516 Kestrel Place NE
- 14419 Brownsville Hwy NE
- 14522 Kestrel Place NE
- 14449 Kestrel Place NE
- 14487 Brownsville Hwy NE
- 14455 Kestrel Place NE
- 14461 Kestrel Place NE
- 14505 Kestrel Place NE
- 14511 Kestrel Place NE
- 14517 Kestrel Place NE
- 14555 Brownsville Hwy NE
- 14395 Brownsville Hwy NE