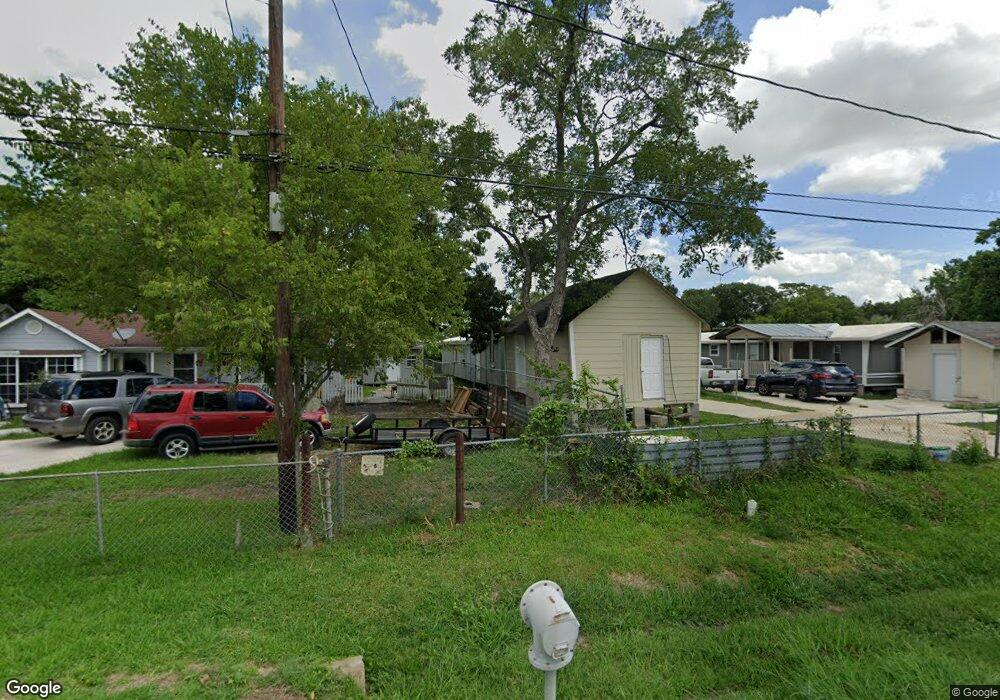
14425 Waxahachie St Houston, TX 77015
Estimated Value: $185,000 - $256,000
3
Beds
5
Baths
1,230
Sq Ft
$172/Sq Ft
Est. Value
About This Home
This home is located at 14425 Waxahachie St, Houston, TX 77015 and is currently estimated at $211,718, approximately $172 per square foot. 14425 Waxahachie St is a home located in Harris County with nearby schools including Sam Houston Elementary School, Cobb 6th Grade Campus, and North Shore Middle School.
Ownership History
Date
Name
Owned For
Owner Type
Purchase Details
Closed on
Jul 16, 2018
Sold by
Bures Linda and Estate Of Margie Lois Whitesid
Bought by
Sanchez Carlos and Sanchez Maria Guerra
Current Estimated Value
Home Financials for this Owner
Home Financials are based on the most recent Mortgage that was taken out on this home.
Original Mortgage
$80,000
Outstanding Balance
$69,332
Interest Rate
4.5%
Mortgage Type
New Conventional
Estimated Equity
$142,386
Purchase Details
Closed on
Dec 26, 2000
Sold by
Whiteside Margie Lois
Bought by
Whiteside Margie Lois
Purchase Details
Closed on
Sep 11, 1995
Sold by
Walters Orville H
Bought by
Whiteside Ernest and Whiteside Margie
Purchase Details
Closed on
May 27, 1994
Sold by
Rhodes Willie Loyce and Clowers Daphyne Rhodes
Bought by
Whiteside Ernest H and Whiteside Margie L
Create a Home Valuation Report for This Property
The Home Valuation Report is an in-depth analysis detailing your home's value as well as a comparison with similar homes in the area
Home Values in the Area
Average Home Value in this Area
Purchase History
| Date | Buyer | Sale Price | Title Company |
|---|---|---|---|
| Sanchez Carlos | -- | Capital Title | |
| Whiteside Margie Lois | -- | -- | |
| Whiteside Margie Lois | -- | -- | |
| Whiteside Ernest | -- | -- | |
| Whiteside Ernest H | -- | -- |
Source: Public Records
Mortgage History
| Date | Status | Borrower | Loan Amount |
|---|---|---|---|
| Open | Sanchez Carlos | $80,000 |
Source: Public Records
Tax History Compared to Growth
Tax History
| Year | Tax Paid | Tax Assessment Tax Assessment Total Assessment is a certain percentage of the fair market value that is determined by local assessors to be the total taxable value of land and additions on the property. | Land | Improvement |
|---|---|---|---|---|
| 2025 | $5,332 | $236,246 | $162,900 | $73,346 |
| 2024 | $5,332 | $238,975 | $162,900 | $76,075 |
| 2023 | $5,332 | $197,383 | $97,740 | $99,643 |
| 2022 | $4,204 | $175,751 | $97,740 | $78,011 |
| 2021 | $3,579 | $138,440 | $77,378 | $61,062 |
| 2020 | $3,431 | $129,484 | $77,378 | $52,106 |
| 2019 | $3,411 | $122,001 | $77,378 | $44,623 |
| 2018 | $1,499 | $95,281 | $77,378 | $17,903 |
| 2017 | $2,619 | $93,920 | $77,378 | $16,542 |
| 2016 | $2,468 | $93,920 | $77,378 | $16,542 |
| 2015 | $193 | $93,920 | $77,378 | $16,542 |
| 2014 | $193 | $73,129 | $57,015 | $16,114 |
Source: Public Records
Map
Nearby Homes
- 14613 Hillsboro St
- 14500 Corpus Christi St Unit 4
- 14504 Corpus Christi St Unit 4
- 14506 Corpus Christi St Unit 4
- 14307 Laredo St
- 813 Barbara Mae St
- 816 Barbara Mae St
- 14619 Brownsville St
- 14512 Texarkana St
- 639 Manor St
- 14334 Texarkana St
- 14615 Victoria St
- 0 Victoria St
- 14548 Gainesville St
- 623 Rockbrook Dr
- 638 Hollywood St
- 719 Manor St
- 634 Bright Penny Ln
- 14750 Kenny St
- 14902 Woodford St
- 14443 Waxahachie St
- 14426 Hillsboro St
- 14419 Waxahachie St
- 14434 Hillsboro St
- 14447 Waxahachie St
- 14438 Hillsboro St
- 844 Nancy Rose St
- 14410 Hillsboro St
- 836 Nancy Rose St
- 14410 Waxahachie St
- 14431 Hillsboro St
- 835 Cloverleaf St
- 14435 Hillsboro St
- 903 Cloverleaf St
- 909 Cloverleaf St
- 14409 Hillsboro St
- 14443 Hillsboro St
- 922 Nancy Rose St
- 915 Cloverleaf St
- 14436 Laredo St