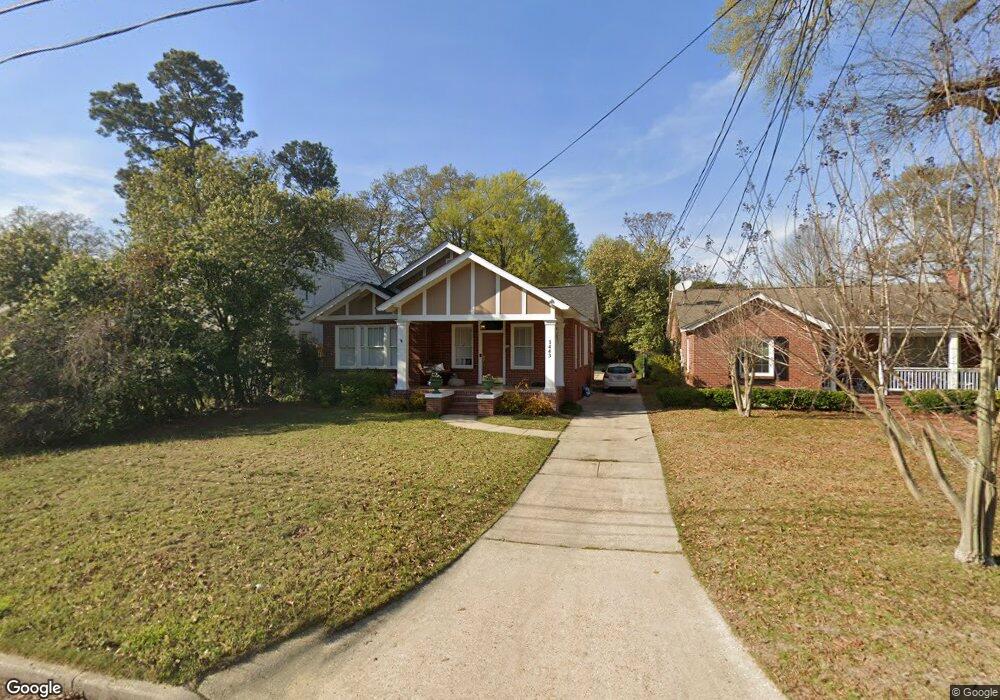
1443 22nd St Columbus, GA 31901
East Highlands NeighborhoodEstimated Value: $218,000 - $247,000
3
Beds
2
Baths
1,491
Sq Ft
$154/Sq Ft
Est. Value
About This Home
This home is located at 1443 22nd St, Columbus, GA 31901 and is currently estimated at $229,028, approximately $153 per square foot. 1443 22nd St is a home located in Muscogee County with nearby schools including Arnold Middle School, Jordan Vocational High School, and Wynnton Elementary School.
Ownership History
Date
Name
Owned For
Owner Type
Purchase Details
Closed on
Sep 2, 2020
Sold by
Inman Cody J
Bought by
Martinez Frank J
Current Estimated Value
Home Financials for this Owner
Home Financials are based on the most recent Mortgage that was taken out on this home.
Original Mortgage
$160,047
Outstanding Balance
$140,915
Interest Rate
2.8%
Mortgage Type
FHA
Estimated Equity
$88,113
Purchase Details
Closed on
May 15, 2014
Sold by
Harrison Angela
Bought by
Inman Cody J and Inman April R
Home Financials for this Owner
Home Financials are based on the most recent Mortgage that was taken out on this home.
Original Mortgage
$151,079
Interest Rate
4.32%
Mortgage Type
VA
Purchase Details
Closed on
Jun 4, 2010
Sold by
Harrison Angela and Hathaway William R
Bought by
Harrison Angela and Hathaway William R
Purchase Details
Closed on
Mar 10, 2010
Sold by
Martin Jeffrey K
Bought by
Harrison Angela and Hathaway William R
Purchase Details
Closed on
Aug 5, 2008
Sold by
Mcleod Douglas K
Bought by
Martin Jeffery K
Create a Home Valuation Report for This Property
The Home Valuation Report is an in-depth analysis detailing your home's value as well as a comparison with similar homes in the area
Home Values in the Area
Average Home Value in this Area
Purchase History
| Date | Buyer | Sale Price | Title Company |
|---|---|---|---|
| Martinez Frank J | $163,000 | -- | |
| Inman Cody J | $147,900 | -- | |
| Harrison Angela | -- | None Available | |
| Harrison Angela | $143,000 | None Available | |
| Martin Jeffery K | $22,000 | None Available |
Source: Public Records
Mortgage History
| Date | Status | Borrower | Loan Amount |
|---|---|---|---|
| Open | Martinez Frank J | $160,047 | |
| Previous Owner | Inman Cody J | $151,079 |
Source: Public Records
Tax History Compared to Growth
Tax History
| Year | Tax Paid | Tax Assessment Tax Assessment Total Assessment is a certain percentage of the fair market value that is determined by local assessors to be the total taxable value of land and additions on the property. | Land | Improvement |
|---|---|---|---|---|
| 2025 | $3,175 | $81,116 | $8,092 | $73,024 |
| 2024 | $3,175 | $81,116 | $8,092 | $73,024 |
| 2023 | $3,195 | $81,116 | $8,092 | $73,024 |
| 2022 | $2,601 | $63,692 | $8,092 | $55,600 |
| 2021 | $2,601 | $63,692 | $8,092 | $55,600 |
| 2020 | $1,869 | $59,608 | $8,092 | $51,516 |
| 2019 | $1,877 | $59,608 | $8,092 | $51,516 |
| 2018 | $1,877 | $59,608 | $8,092 | $51,516 |
| 2017 | $1,885 | $59,608 | $8,092 | $51,516 |
| 2016 | $1,893 | $59,160 | $2,976 | $56,184 |
| 2015 | $1,896 | $59,160 | $2,976 | $56,184 |
| 2014 | $1,783 | $56,365 | $2,976 | $53,389 |
| 2013 | -- | $56,365 | $2,976 | $53,389 |
Source: Public Records
Map
Nearby Homes
- 1441 22nd St Unit C
- 1441 22nd St Unit D
- 1441 22nd St Unit D
- 1441 22nd St Unit A and D
- 1441 22nd St Unit A
- 1439 22nd St
- 1451 22nd St
- 1437 22nd St
- 1503 22nd St
- 1440 22nd St
- 1435 22nd St
- 2117 15th Ave
- 1436 22nd St
- 1434 22nd St
- 1442 23rd St
- 1438 23rd St
- 1446 23rd St
- 1433 22nd St
- 1432 23rd St
- 1430 23rd St