Estimated Value: $636,000 - $766,000
3
Beds
4
Baths
2,544
Sq Ft
$277/Sq Ft
Est. Value
About This Home
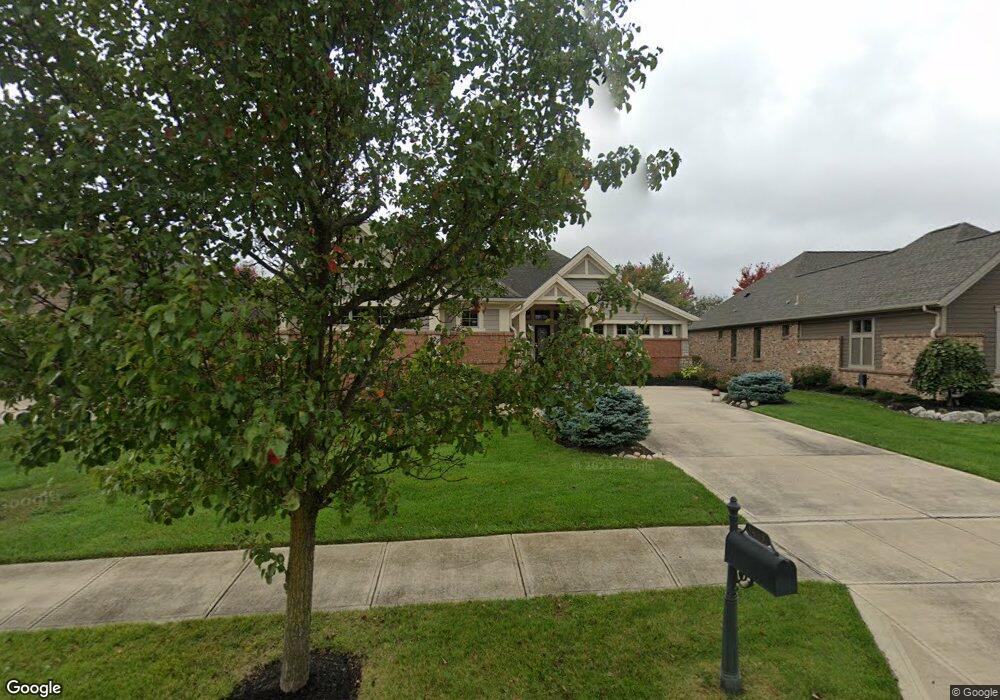
This home is located at 1443 Champions Way, Xenia, OH 45385 and is currently estimated at $705,626, approximately $277 per square foot. 1443 Champions Way is a home located in Greene County with nearby schools including Trebein Elementary School, Jacob Coy Middle School, and Beavercreek High School.
Ownership History
Date
Name
Owned For
Owner Type
Purchase Details
Closed on
Aug 14, 2014
Sold by
Reno Loren M and Reno Karen C
Bought by
Reno Living Trust
Current Estimated Value
Purchase Details
Closed on
Mar 9, 2012
Sold by
White Shawn M and White Abigail
Bought by
Reno Loren M and Reno Karen C
Home Financials for this Owner
Home Financials are based on the most recent Mortgage that was taken out on this home.
Original Mortgage
$417,750
Outstanding Balance
$286,828
Interest Rate
3.86%
Mortgage Type
VA
Estimated Equity
$418,798
Purchase Details
Closed on
Nov 17, 2010
Sold by
G A White Development Co Llc
Bought by
White Shawn M
Home Financials for this Owner
Home Financials are based on the most recent Mortgage that was taken out on this home.
Original Mortgage
$200,000
Interest Rate
4%
Mortgage Type
Adjustable Rate Mortgage/ARM
Create a Home Valuation Report for This Property
The Home Valuation Report is an in-depth analysis detailing your home's value as well as a comparison with similar homes in the area
Home Values in the Area
Average Home Value in this Area
Purchase History
| Date | Buyer | Sale Price | Title Company |
|---|---|---|---|
| Reno Living Trust | -- | None Available | |
| Reno Loren M | $418,000 | Attorney | |
| White Shawn M | $50,000 | Attorney |
Source: Public Records
Mortgage History
| Date | Status | Borrower | Loan Amount |
|---|---|---|---|
| Open | Reno Loren M | $417,750 | |
| Previous Owner | White Shawn M | $200,000 |
Source: Public Records
Tax History Compared to Growth
Tax History
| Year | Tax Paid | Tax Assessment Tax Assessment Total Assessment is a certain percentage of the fair market value that is determined by local assessors to be the total taxable value of land and additions on the property. | Land | Improvement |
|---|---|---|---|---|
| 2024 | $11,710 | $203,890 | $29,550 | $174,340 |
| 2023 | $11,710 | $203,890 | $29,550 | $174,340 |
| 2022 | $10,822 | $165,210 | $25,700 | $139,510 |
| 2021 | $10,930 | $165,210 | $25,700 | $139,510 |
| 2020 | $10,982 | $165,210 | $25,700 | $139,510 |
| 2019 | $10,718 | $148,070 | $23,950 | $124,120 |
| 2018 | $9,371 | $148,070 | $23,950 | $124,120 |
| 2017 | $9,196 | $148,070 | $23,950 | $124,120 |
| 2016 | $9,094 | $141,700 | $20,960 | $120,740 |
| 2015 | $9,151 | $141,700 | $20,960 | $120,740 |
| 2014 | $8,722 | $141,700 | $20,960 | $120,740 |
Source: Public Records
Map
Nearby Homes
- 1462 Champions Way
- 1382 Prestonwood Ct S
- 1247 Homestead Dr
- Torino II Plan at The Courtyards at Stonehill Village
- Palazzo Plan at The Courtyards at Stonehill Village
- Promenade III Plan at The Courtyards at Stonehill Village
- Portico Plan at The Courtyards at Stonehill Village
- Verona Plan at The Courtyards at Stonehill Village
- 1427 Triple Crown Way
- 1589 Stonebury Ct
- 1121 Westover Rd
- 1678 Fairground Rd
- 1416 Hilltop Rd
- 1481 Stone Ridge Ct
- 1238 Freedom Point
- 2073 Lincolnshire Dr
- 1535 Stretch Dr
- 2162 Sulky Trail
- 2331 Eastwind Dr
- 2067 Codaz Way
- 1439 Champions Way
- 1451 Champions Way
- 1461 Champions Way
- 1435 Champions Way
- 1412 Runnymeade Way
- 1465 Champions Way
- 1416 Runnymeade Way
- 1425 Champions Way
- 1408 Runnymeade Way
- 1420 Runnymeade Way
- 1436 Champions Way
- 1404 Runnymeade Way
- 1440 Champions Way
- 1424 Runnymeade Way
- 1415 Champions Way
- 1450 Champions Way
- 1426 Champions Way
- 1458 Champions Way
- 1430 Runnymeade Way
- 1409 Champions Way