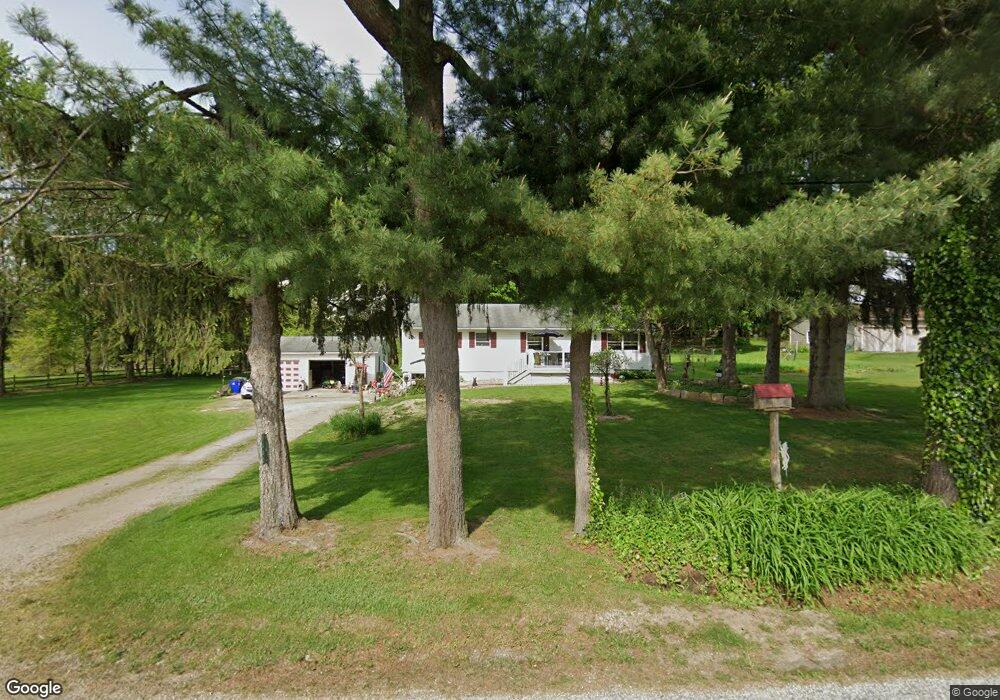
1443 Conley Rd Mogadore, OH 44260
Estimated Value: $175,000 - $244,000
3
Beds
1
Bath
1,248
Sq Ft
$170/Sq Ft
Est. Value
About This Home
This home is located at 1443 Conley Rd, Mogadore, OH 44260 and is currently estimated at $212,135, approximately $169 per square foot. 1443 Conley Rd is a home located in Portage County with nearby schools including Suffield Elementary School, Field Middle School, and Field High School.
Ownership History
Date
Name
Owned For
Owner Type
Purchase Details
Closed on
Apr 27, 2020
Sold by
Shireliff Matthews S and Shireliff Ruth
Bought by
Dolinger Wade and Dolinger Karen
Current Estimated Value
Home Financials for this Owner
Home Financials are based on the most recent Mortgage that was taken out on this home.
Original Mortgage
$121,250
Outstanding Balance
$107,444
Interest Rate
3.3%
Mortgage Type
New Conventional
Estimated Equity
$104,691
Purchase Details
Closed on
Apr 12, 2018
Sold by
Shircliff Robert and Middleton Rebecca
Bought by
Shircliff Matthew S and Shircliff Ruth E
Purchase Details
Closed on
Mar 3, 2011
Sold by
Shircliff Joseph A and Shircliff Margaret M
Bought by
Shircliff Robert and Middleton Rebecca
Purchase Details
Closed on
Sep 21, 1999
Sold by
Shircliff Joseph and Shircliff Margaret
Bought by
Shircliff Joseph A and Shircliff Margaret M
Purchase Details
Closed on
Jan 1, 1990
Bought by
Shircliff Joseph A
Create a Home Valuation Report for This Property
The Home Valuation Report is an in-depth analysis detailing your home's value as well as a comparison with similar homes in the area
Home Values in the Area
Average Home Value in this Area
Purchase History
| Date | Buyer | Sale Price | Title Company |
|---|---|---|---|
| Dolinger Wade | $125,000 | Multiple | |
| Shircliff Matthew S | -- | None Available | |
| Shircliff Robert | -- | Attorney | |
| Shircliff Joseph A | -- | -- | |
| Shircliff Joseph A | -- | -- |
Source: Public Records
Mortgage History
| Date | Status | Borrower | Loan Amount |
|---|---|---|---|
| Open | Dolinger Wade | $121,250 |
Source: Public Records
Tax History Compared to Growth
Tax History
| Year | Tax Paid | Tax Assessment Tax Assessment Total Assessment is a certain percentage of the fair market value that is determined by local assessors to be the total taxable value of land and additions on the property. | Land | Improvement |
|---|---|---|---|---|
| 2024 | $2,466 | $61,290 | $12,710 | $48,580 |
| 2023 | $2,362 | $47,920 | $9,840 | $38,080 |
| 2022 | $2,335 | $47,360 | $9,840 | $37,520 |
| 2021 | $2,321 | $47,360 | $9,840 | $37,520 |
| 2020 | $2,242 | $40,850 | $9,840 | $31,010 |
| 2019 | $2,250 | $40,850 | $9,840 | $31,010 |
| 2018 | $1,603 | $34,650 | $10,780 | $23,870 |
| 2017 | $1,603 | $34,650 | $10,780 | $23,870 |
| 2016 | $1,587 | $34,650 | $10,780 | $23,870 |
| 2015 | $1,588 | $34,650 | $10,780 | $23,870 |
| 2014 | $1,546 | $34,650 | $10,780 | $23,870 |
| 2013 | $1,534 | $34,650 | $10,780 | $23,870 |
Source: Public Records
Map
Nearby Homes
- 0 Shaffer Rd
- 3381 Alexander Rd
- 2829 Willow Glen Trail
- 2071 Hartville Rd
- 1811 Randolph Rd
- 0 Hartville Rd
- 2516 Ranfield Rd
- 3705 Alexander Rd
- 1195 Etter Rd
- 2824 Saxe Rd
- S/L 11 959 Sunrise Dr
- 2236 Hartville Rd
- S/L 38 1150 Lakeview Dr
- S/L 37 1140 Lakeview Dr
- VL 863 State Route 43
- 0 Randolph Rd Unit 5112744
- 1369 S Polen Ave
- 3459 Laubert Rd
- 1291 State Route 44
- 1696 State Route 44
- 1455 Conley Rd
- 1450 Conley Rd
- 1466 Conley Rd
- 2537 Waterloo Rd
- 2485 Waterloo Rd
- 2536 Waterloo Rd
- 2551 Waterloo Rd
- 1475 Conley Rd
- 2471 Waterloo Rd
- 2558 Waterloo Rd
- 2564 Waterloo Rd
- 0 Alexander Rd Unit 3642347
- 2453 Waterloo Rd
- 1515 Conley Rd
- 1375 Aberagg Rd
- 2582 Waterloo Rd
- 2596 Waterloo Rd
- 1535 Conley Rd
- 2450 Waterloo Rd
- 2440 Waterloo Rd