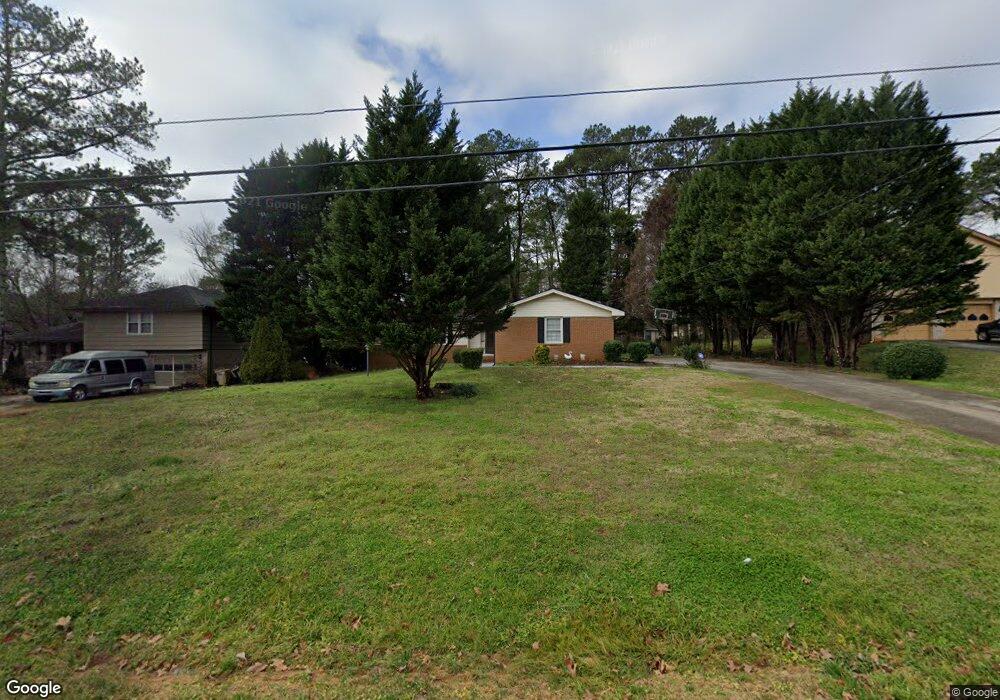
1443 Martin Nash Rd SW Lilburn, GA 30047
Estimated Value: $326,000 - $358,000
3
Beds
2
Baths
1,782
Sq Ft
$192/Sq Ft
Est. Value
About This Home
This home is located at 1443 Martin Nash Rd SW, Lilburn, GA 30047 and is currently estimated at $342,546, approximately $192 per square foot. 1443 Martin Nash Rd SW is a home located in Gwinnett County with nearby schools including Head Elementary School, Five Forks Middle School, and Brookwood High School.
Ownership History
Date
Name
Owned For
Owner Type
Purchase Details
Closed on
Feb 14, 2020
Sold by
Hossain R
Bought by
Hossain R R and Hossain Nuruzzaman
Current Estimated Value
Home Financials for this Owner
Home Financials are based on the most recent Mortgage that was taken out on this home.
Original Mortgage
$187,210
Outstanding Balance
$165,053
Interest Rate
3.6%
Mortgage Type
New Conventional
Estimated Equity
$177,493
Purchase Details
Closed on
Jun 25, 2013
Sold by
Ralph Sutera and Esther Co T
Bought by
Lee Joncey
Home Financials for this Owner
Home Financials are based on the most recent Mortgage that was taken out on this home.
Original Mortgage
$122,735
Interest Rate
4.37%
Mortgage Type
FHA
Purchase Details
Closed on
Dec 17, 1996
Sold by
Brand Gordon G
Bought by
Sutera Esther Ralph
Create a Home Valuation Report for This Property
The Home Valuation Report is an in-depth analysis detailing your home's value as well as a comparison with similar homes in the area
Home Values in the Area
Average Home Value in this Area
Purchase History
| Date | Buyer | Sale Price | Title Company |
|---|---|---|---|
| Hossain R R | -- | -- | |
| Hossain R | -- | -- | |
| Lee Joncey | $125,000 | -- | |
| Sutera Esther Ralph | $95,000 | -- |
Source: Public Records
Mortgage History
| Date | Status | Borrower | Loan Amount |
|---|---|---|---|
| Open | Hossain R | $187,210 | |
| Closed | Hossain R R | $187,210 | |
| Previous Owner | Lee Joncey | $122,735 |
Source: Public Records
Tax History Compared to Growth
Tax History
| Year | Tax Paid | Tax Assessment Tax Assessment Total Assessment is a certain percentage of the fair market value that is determined by local assessors to be the total taxable value of land and additions on the property. | Land | Improvement |
|---|---|---|---|---|
| 2025 | $3,818 | $125,800 | $30,000 | $95,800 |
| 2024 | $3,850 | $121,560 | $30,000 | $91,560 |
| 2023 | $3,850 | $123,800 | $26,400 | $97,400 |
| 2022 | $3,574 | $110,040 | $23,600 | $86,440 |
| 2021 | $2,925 | $77,200 | $18,400 | $58,800 |
| 2020 | $2,476 | $75,560 | $16,000 | $59,560 |
| 2019 | $2,344 | $72,080 | $13,600 | $58,480 |
| 2018 | $2,272 | $68,840 | $13,600 | $55,240 |
| 2016 | $2,003 | $55,400 | $11,600 | $43,800 |
| 2015 | $1,819 | $46,320 | $9,200 | $37,120 |
| 2014 | -- | $46,320 | $9,200 | $37,120 |
Source: Public Records
Map
Nearby Homes
- 3331 Manchester Dr SW
- 1314 Elk Terrace SW
- 3190 Wood Springs Trace SW
- 3173 Falconhurst Dr SW
- 1293 Elk Terrace SW
- 1221 Martin Nash Rd SW
- 3207 Aspen Cir SW
- 1721 Bruckner Ct
- 3222 Martin Dr SW
- 3321 Newburn St SW
- 0 Golden Cir SW Unit 10639989
- 0000 Golden Cir SW
- 1220 Edgebrook Ln
- 1795 Elmwood Cir
- 3663 Stonelake Ct SW Unit 1
- 3063 Bruckner Blvd
- 5299 Noble Village Way
- 5099 Noble Village Way
- 1453 Martin Nash Rd SW
- 1433 Martin Nash Rd SW
- 1436 Manchester Ct SW
- 1446 Manchester Ct SW
- 1423 Martin Nash Rd SW
- 1463 Martin Nash Rd SW
- 1426 Manchester Ct SW
- 1432 Martin Nash Rd SW
- 1442 Martin Nash Rd SW
- 1473 Martin Nash Rd SW
- 1456 Manchester Ct SW
- 1452 Martin Nash Rd SW Unit 25
- 1452 Martin Nash Rd SW
- 1452 Martin Nash Rd SW Unit 2
- 1413 Martin Nash Rd SW
- 1416 Manchester Ct SW
- 3311 Manchester Dr SW
- 3296 Brownlee Ln SW
- 1462 Martin Nash Rd SW
- 1447 Manchester Ct SW