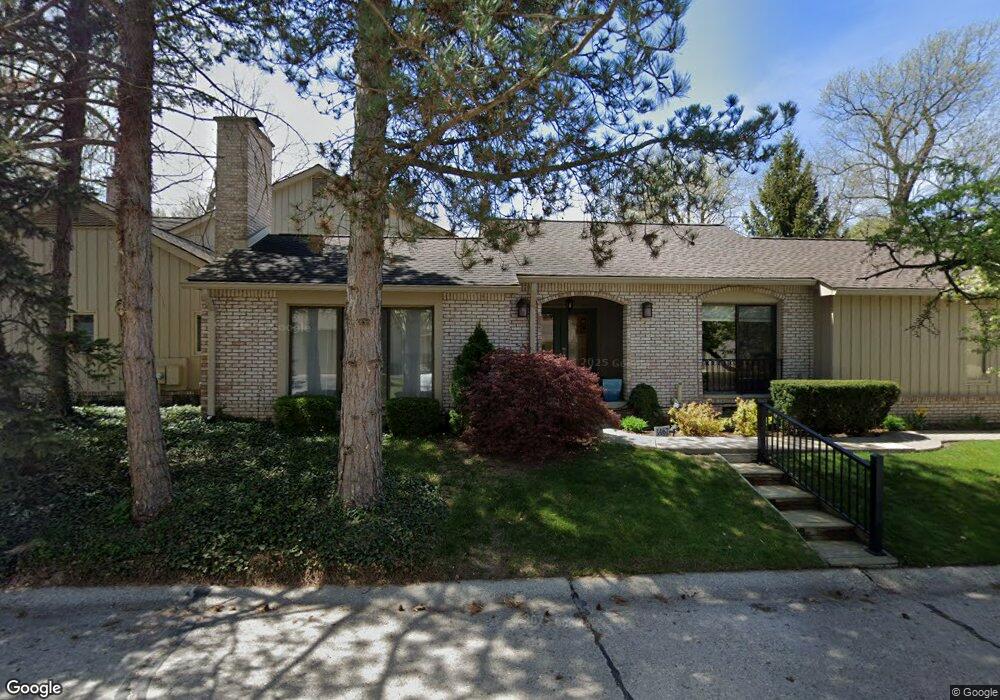
1443 Ravineview Ct Bloomfield Hills, MI 48304
Estimated Value: $455,000 - $535,000
2
Beds
2
Baths
1,634
Sq Ft
$304/Sq Ft
Est. Value
About This Home
This home is located at 1443 Ravineview Ct, Bloomfield Hills, MI 48304 and is currently estimated at $496,265, approximately $303 per square foot. 1443 Ravineview Ct is a home located in Oakland County with nearby schools including Eastover Elementary School, Bloomfield Hills High School, and Arts & Technology Academy of Pontiac.
Ownership History
Date
Name
Owned For
Owner Type
Purchase Details
Closed on
Aug 25, 2020
Sold by
Jakeway Patrick R
Bought by
Fehan Douglas R and Champagne Gayle L
Current Estimated Value
Purchase Details
Closed on
Jan 13, 2014
Sold by
Serba Kevin and Tamer Timothy J
Bought by
Jakeway Patrick R
Home Financials for this Owner
Home Financials are based on the most recent Mortgage that was taken out on this home.
Original Mortgage
$256,000
Interest Rate
2.75%
Mortgage Type
Adjustable Rate Mortgage/ARM
Purchase Details
Closed on
Sep 19, 2013
Sold by
Tamer Timothy J and Serba Kevin
Bought by
Tamer Timothy J and Serba Kevin
Purchase Details
Closed on
Nov 14, 2011
Sold by
The Geraldine A Hasler Trust
Bought by
Tamer Timothy J and Serba Kevin
Create a Home Valuation Report for This Property
The Home Valuation Report is an in-depth analysis detailing your home's value as well as a comparison with similar homes in the area
Home Values in the Area
Average Home Value in this Area
Purchase History
| Date | Buyer | Sale Price | Title Company |
|---|---|---|---|
| Fehan Douglas R | $425,000 | None Available | |
| Jakeway Patrick R | $320,000 | Devon Title Agency | |
| Tamer Timothy J | -- | None Available | |
| Tamer Timothy J | $140,000 | Devon Title Agency |
Source: Public Records
Mortgage History
| Date | Status | Borrower | Loan Amount |
|---|---|---|---|
| Previous Owner | Jakeway Patrick R | $256,000 |
Source: Public Records
Tax History Compared to Growth
Tax History
| Year | Tax Paid | Tax Assessment Tax Assessment Total Assessment is a certain percentage of the fair market value that is determined by local assessors to be the total taxable value of land and additions on the property. | Land | Improvement |
|---|---|---|---|---|
| 2024 | $3,748 | $209,130 | $0 | $0 |
| 2023 | $3,576 | $196,320 | $0 | $0 |
| 2022 | $6,662 | $182,380 | $0 | $0 |
| 2021 | $6,716 | $182,420 | $0 | $0 |
| 2020 | $2,455 | $167,850 | $0 | $0 |
| 2019 | $4,754 | $166,330 | $0 | $0 |
| 2018 | $6,916 | $147,500 | $0 | $0 |
| 2017 | $4,594 | $142,810 | $0 | $0 |
| 2016 | $4,587 | $139,200 | $0 | $0 |
| 2015 | -- | $121,000 | $0 | $0 |
| 2014 | -- | $95,990 | $0 | $0 |
| 2011 | -- | $87,140 | $0 | $0 |
Source: Public Records
Map
Nearby Homes
- 1470 Timberview Trail
- 1339 Knollcrest Cir
- 1204 S Timberview Trail Unit E 23
- 1289 Greenglen Ct
- 1285 Greenglen Ct
- 1105 Ivyglen Cir
- 6965 N Adams Rd
- 6950 Killarney Dr
- 1299 Winchcombe Dr
- 1926 Hickory Bark Ln
- 1916 Squirrel Valley Dr
- 6678 Johnathon Dr
- 2156 Park Ridge Dr
- 2953 Squire Ct
- 3077 Claret Ln
- 624 Slocum Dr
- 6890 Duchess Ct
- 3052 Claret Ln
- 1717 Brandywine Dr
- 3072 Henrydale St
- 1443 Ravineview Ct
- 1475 Ravineview Ct Unit B9
- 1427 Ravineview Ct Unit 19
- 1463 Ravineview Ct Unit 29
- 1415 Ravineview Ct
- 6496 Tutbury Ln
- 2959 Tewksbury Dr
- 6495 Tutbury Ln
- 1464 Timberview Trail
- 1464 Timberview Trail Unit A-A 103
- 2956 Tewksbury Dr
- 1406 Timberview Trail
- 1406 Timberview Trail Unit 1
- 1400 Timberview Trail Unit 4
- 1404 Timberview Trail Unit Bldg-Unit
- 1467 Ravineview Ct Unit Bldg-Unit
- 1466 Timberview Trail
- 1468 Timberview Trail
- 1472 Timberview Trail Unit AA99
- 1386 Bramblebush Run