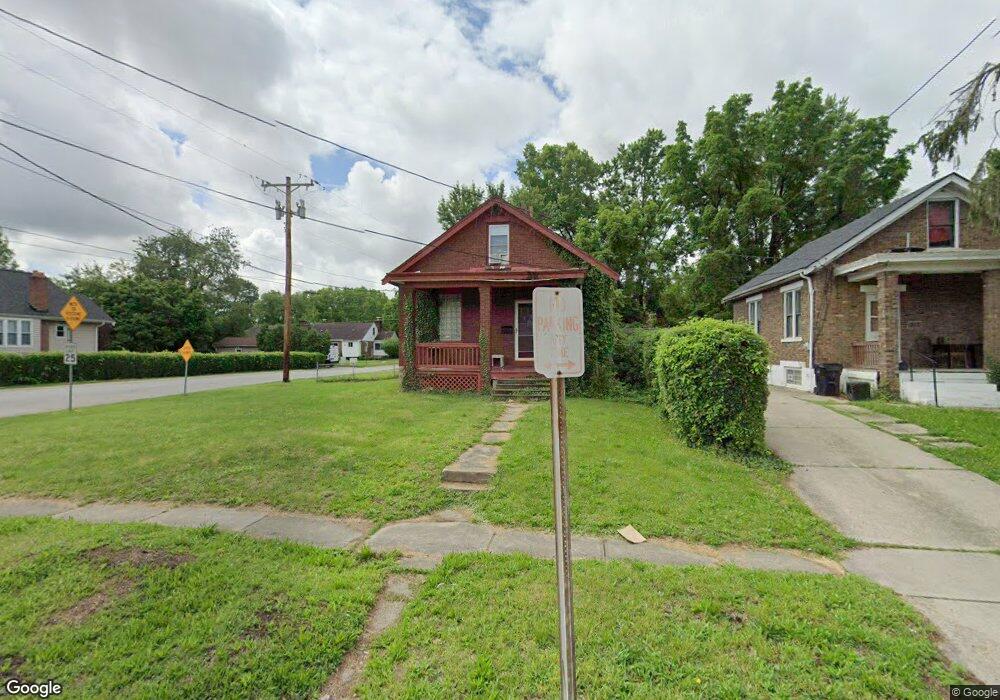
1443 Section Rd Cincinnati, OH 45237
Roselawn NeighborhoodEstimated Value: $134,000 - $176,000
2
Beds
1
Bath
1,101
Sq Ft
$140/Sq Ft
Est. Value
About This Home
This home is located at 1443 Section Rd, Cincinnati, OH 45237 and is currently estimated at $154,038, approximately $139 per square foot. 1443 Section Rd is a home located in Hamilton County with nearby schools including Roselawn Condon School, Shroder High School, and Clark Montessori High School.
Ownership History
Date
Name
Owned For
Owner Type
Purchase Details
Closed on
Jun 8, 2010
Sold by
The Secretary Of Veterans Affairs
Bought by
Ferrell Dawn M and Mceachin Derrick
Current Estimated Value
Purchase Details
Closed on
Jan 4, 2010
Sold by
Jenkins Samuel
Bought by
Secretary Of Veterans Affairs
Purchase Details
Closed on
Mar 30, 1996
Sold by
Burbridge Susan E
Bought by
Jenkins Samuel
Home Financials for this Owner
Home Financials are based on the most recent Mortgage that was taken out on this home.
Original Mortgage
$61,302
Interest Rate
7.36%
Mortgage Type
VA
Purchase Details
Closed on
Jan 31, 1996
Sold by
Reckman Mark S and Brisker Shirley
Bought by
Burbidge Susan E
Home Financials for this Owner
Home Financials are based on the most recent Mortgage that was taken out on this home.
Original Mortgage
$61,302
Interest Rate
7.36%
Mortgage Type
VA
Create a Home Valuation Report for This Property
The Home Valuation Report is an in-depth analysis detailing your home's value as well as a comparison with similar homes in the area
Home Values in the Area
Average Home Value in this Area
Purchase History
| Date | Buyer | Sale Price | Title Company |
|---|---|---|---|
| Ferrell Dawn M | -- | Nova Title Agency Inc | |
| Secretary Of Veterans Affairs | $44,000 | None Available | |
| Jenkins Samuel | $60,100 | -- | |
| Burbidge Susan E | $35,000 | -- |
Source: Public Records
Mortgage History
| Date | Status | Borrower | Loan Amount |
|---|---|---|---|
| Previous Owner | Jenkins Samuel | $61,302 | |
| Previous Owner | Burbidge Susan E | $34,400 |
Source: Public Records
Tax History
| Year | Tax Paid | Tax Assessment Tax Assessment Total Assessment is a certain percentage of the fair market value that is determined by local assessors to be the total taxable value of land and additions on the property. | Land | Improvement |
|---|---|---|---|---|
| 2025 | $2,052 | $31,501 | $8,901 | $22,600 |
| 2023 | $2,053 | $31,501 | $8,901 | $22,600 |
| 2022 | $1,324 | $17,984 | $7,774 | $10,210 |
| 2021 | $1,284 | $17,984 | $7,774 | $10,210 |
| 2020 | $1,288 | $17,984 | $7,774 | $10,210 |
| 2019 | $1,298 | $16,499 | $7,133 | $9,366 |
| 2018 | $1,299 | $16,499 | $7,133 | $9,366 |
| 2017 | $1,249 | $16,499 | $7,133 | $9,366 |
| 2016 | $1,234 | $15,898 | $7,277 | $8,621 |
| 2015 | $1,107 | $15,898 | $7,277 | $8,621 |
| 2014 | $1,112 | $15,898 | $7,277 | $8,621 |
| 2013 | $1,107 | $15,586 | $7,133 | $8,453 |
Source: Public Records
Map
Nearby Homes
- 1519 Section Rd
- 1501 Summit Rd
- 1622 Shenandoah Ave
- 1522 Kenova Ave
- 1535 Kenova Ave
- 8081 Woodbine Ave
- 7833 Dawn Rd
- 7119 Eastlawn Dr
- 3 W 73rd St
- 130 Nansen St
- 1808 Crest Hill Ave
- 7123 Fairpark Ave
- 120 W Seventy Second St
- 29 Hartwell Ct
- 6770 Elbrook Ave
- 6750 Elbrook Ave
- 206 W 69th St
- 8338 Anthony Wayne Ave
- 2344 Losantiville Ave
- 2063 E Seymour Ave
- 1437 Section Rd
- 1431 Section Rd
- 1503 Section Rd
- 1425 Section Rd
- 1507 Section Rd
- 1434 Shenandoah Ave
- 1430 Shenandoah Ave
- 1438 Section Rd
- 1434 Section Rd
- 1436 Section Rd
- 1502 Section Rd
- 1502 Section Rd
- 1502 Section Rd
- 1502 Section Rd
- 1502 Section Rd Unit 4
- 1502 Section Rd Unit 1
- 1502 Section Rd Unit 3
- 1426 Shenandoah Ave
- 1419 Section Rd
- 1430 Section Rd
Your Personal Tour Guide
Ask me questions while you tour the home.