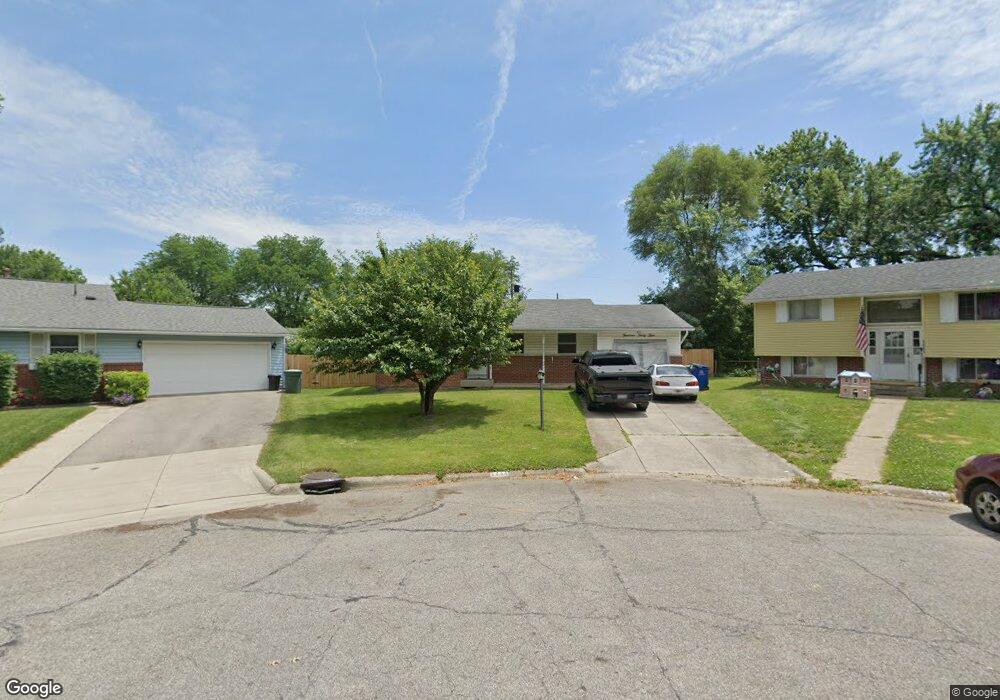
1444 Burnley Ct Columbus, OH 43229
Devonshire NeighborhoodEstimated Value: $221,942 - $239,000
3
Beds
1
Bath
949
Sq Ft
$245/Sq Ft
Est. Value
About This Home
This home is located at 1444 Burnley Ct, Columbus, OH 43229 and is currently estimated at $232,236, approximately $244 per square foot. 1444 Burnley Ct is a home located in Franklin County with nearby schools including Devonshire Alternative Elementary School, Woodward Park Middle School, and Beechcroft High School.
Ownership History
Date
Name
Owned For
Owner Type
Purchase Details
Closed on
Oct 25, 2007
Sold by
Williams Bradd J and Williams Marsha A
Bought by
Lopez Ernesto J
Current Estimated Value
Home Financials for this Owner
Home Financials are based on the most recent Mortgage that was taken out on this home.
Original Mortgage
$105,069
Outstanding Balance
$66,684
Interest Rate
6.44%
Mortgage Type
FHA
Estimated Equity
$165,552
Purchase Details
Closed on
Apr 6, 2007
Sold by
Hud
Bought by
Williams Bradd J and Williams Marsha A
Purchase Details
Closed on
Sep 27, 2006
Sold by
Schlesinger Mark R and Citimortgage Inc
Bought by
Hud
Purchase Details
Closed on
Aug 29, 2003
Sold by
Hertz Ralph and Hertz Mary Scheldra
Bought by
Schlesinger Mark R and Schlesinger Tina M
Home Financials for this Owner
Home Financials are based on the most recent Mortgage that was taken out on this home.
Original Mortgage
$101,398
Interest Rate
6.18%
Mortgage Type
FHA
Purchase Details
Closed on
Oct 11, 1972
Bought by
Hertz Ralph and Hertz Mary S
Create a Home Valuation Report for This Property
The Home Valuation Report is an in-depth analysis detailing your home's value as well as a comparison with similar homes in the area
Home Values in the Area
Average Home Value in this Area
Purchase History
| Date | Buyer | Sale Price | Title Company |
|---|---|---|---|
| Lopez Ernesto J | $105,900 | Stewart Ti | |
| Williams Bradd J | $84,400 | Lakeside Ti | |
| Hud | $80,000 | None Available | |
| Schlesinger Mark R | $102,500 | Real Living Title | |
| Hertz Ralph | -- | -- |
Source: Public Records
Mortgage History
| Date | Status | Borrower | Loan Amount |
|---|---|---|---|
| Open | Lopez Ernesto J | $105,069 | |
| Previous Owner | Schlesinger Mark R | $101,398 |
Source: Public Records
Tax History Compared to Growth
Tax History
| Year | Tax Paid | Tax Assessment Tax Assessment Total Assessment is a certain percentage of the fair market value that is determined by local assessors to be the total taxable value of land and additions on the property. | Land | Improvement |
|---|---|---|---|---|
| 2024 | $3,038 | $67,700 | $20,130 | $47,570 |
| 2023 | $3,000 | $67,690 | $20,125 | $47,565 |
| 2022 | $2,026 | $39,060 | $12,040 | $27,020 |
| 2021 | $2,029 | $39,060 | $12,040 | $27,020 |
| 2020 | $2,032 | $39,060 | $12,040 | $27,020 |
| 2019 | $1,869 | $30,810 | $9,630 | $21,180 |
| 2018 | $1,762 | $30,810 | $9,630 | $21,180 |
| 2017 | $1,848 | $30,810 | $9,630 | $21,180 |
| 2016 | $1,828 | $27,590 | $8,300 | $19,290 |
| 2015 | $1,659 | $27,590 | $8,300 | $19,290 |
| 2014 | $1,663 | $27,590 | $8,300 | $19,290 |
| 2013 | $911 | $30,625 | $9,205 | $21,420 |
Source: Public Records
Map
Nearby Homes
- 6035 Karl Rd
- 1549 Alpine Dr
- 5990 Ambleside Dr
- 1288 Oakfield Dr N
- 1390 E Dublin Granville Rd
- 6189 Northgap Dr
- 1171 Newbury Dr
- 6211 Parkdale Dr
- 6342 Bellmeadow Dr
- 6407 Faircrest Rd
- 1268 Kildale Ct
- 1752 Pine Tree St S Unit H
- 1743 Pine Tree St N Unit A
- 6458 Faircrest Rd
- 1492 Cottonwood Dr
- 1687 Brookfield Square S
- 1409 Bosworth Place
- 1421 Bosworth Place
- 6019 Beechcroft Rd
- 6407 Skywae Dr
- 1441 Burnley Ct
- 1440 Burnley Ct
- 6099 Burnley Square E
- 6087 Burnley Square E
- 1435 Burnley Ct
- 1436 Burnley Ct
- 6081 Burnley Square E
- 6105 Burnley Square E
- 1427 Burnley Ct
- 1428 Burnley Ct
- 6111 Burnley Square E
- 6075 Burnley Square E
- 1452 Burnley Square S
- 1453 Burnley Square N
- 1446 Burnley Square S
- 1443 Burnley Square N
- 1435 Burnley Square N
- 1434 Burnley Square S
- 1421 Burnley Ct
- 1420 Burnley Ct