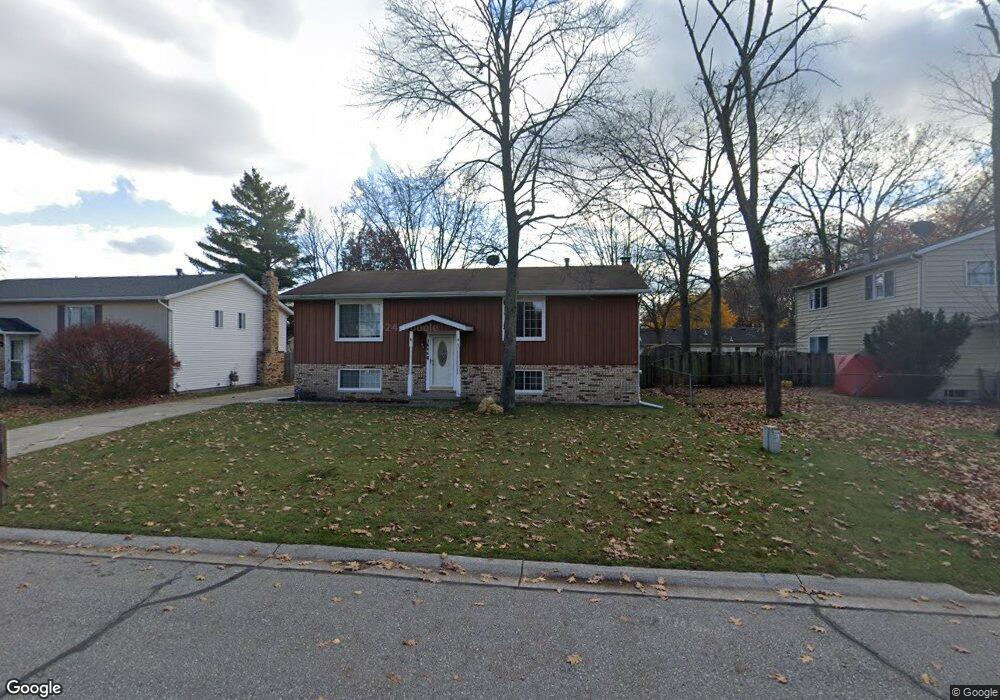
1444 Hazelwood Ln Unit Bldg-Unit Port Huron, MI 48060
Estimated Value: $214,000 - $262,385
4
Beds
3
Baths
2,464
Sq Ft
$95/Sq Ft
Est. Value
About This Home
This home is located at 1444 Hazelwood Ln Unit Bldg-Unit, Port Huron, MI 48060 and is currently estimated at $233,346, approximately $94 per square foot. 1444 Hazelwood Ln Unit Bldg-Unit is a home located in St. Clair County with nearby schools including Garfield Elementary School, Holland Woods Middle School, and Port Huron Northern High School.
Ownership History
Date
Name
Owned For
Owner Type
Purchase Details
Closed on
Jun 7, 2024
Sold by
Secretary/Hsng & Urban Dev/Wa Dc
Bought by
Duenaz Dyllan
Current Estimated Value
Home Financials for this Owner
Home Financials are based on the most recent Mortgage that was taken out on this home.
Original Mortgage
$196,037
Outstanding Balance
$193,223
Interest Rate
7.09%
Mortgage Type
New Conventional
Estimated Equity
$40,123
Purchase Details
Closed on
Feb 21, 2024
Sold by
Michigan State Hsng Dev Auth
Bought by
Secretary/Hsng & Urban Dev/Wa Dc
Purchase Details
Closed on
May 4, 2023
Sold by
Sheriff Of St Clair County
Bought by
Michigan State Hsng Dev Auth
Purchase Details
Closed on
Jun 8, 2021
Sold by
Weishaar Paul J and Weishaar Nicole
Bought by
Cavazos Christopher C and Boyce Brianna
Purchase Details
Closed on
Nov 22, 2017
Sold by
Perkins Susan A and Thorpe Lioyd
Bought by
Weishaar Paul J and Weishaar Nicole
Home Financials for this Owner
Home Financials are based on the most recent Mortgage that was taken out on this home.
Original Mortgage
$137,464
Interest Rate
5.12%
Mortgage Type
FHA
Purchase Details
Closed on
Oct 23, 2008
Sold by
Thorpe Lloyd
Bought by
Thorpe Lloyd and Perkins Susan A
Purchase Details
Closed on
Sep 9, 2008
Sold by
Secretary Of Housing & Urban Development
Bought by
Thorpe Lloyd
Purchase Details
Closed on
Nov 17, 2007
Sold by
Chase Home Finance Llc
Bought by
The Secretary Of Housing Urban Developme
Purchase Details
Closed on
May 10, 2007
Sold by
Maynard Craig and Maynard Victoria
Bought by
Chase Home Finance Llc
Purchase Details
Closed on
Mar 22, 2007
Sold by
Maynard Craig and Maynard Victoria Lynn
Bought by
E & A Credit Union
Purchase Details
Closed on
Nov 11, 2005
Sold by
Maynard Craig and Maynard Victoria Lynn
Bought by
Rix David S
Create a Home Valuation Report for This Property
The Home Valuation Report is an in-depth analysis detailing your home's value as well as a comparison with similar homes in the area
Home Values in the Area
Average Home Value in this Area
Purchase History
| Date | Buyer | Sale Price | Title Company |
|---|---|---|---|
| Duenaz Dyllan | $202,100 | None Listed On Document | |
| Secretary/Hsng & Urban Dev/Wa Dc | -- | Servicelink | |
| Michigan State Hsng Dev Auth | $194,721 | None Listed On Document | |
| Cavazos Christopher C | $177,900 | Cislo Title Co | |
| Weishaar Paul J | $140,000 | Liberty Title & Escrow | |
| Thorpe Lloyd | -- | None Available | |
| Thorpe Lloyd | $102,500 | None Available | |
| The Secretary Of Housing Urban Developme | -- | None Available | |
| Chase Home Finance Llc | $140,419 | None Available | |
| E & A Credit Union | $10,823 | None Available | |
| Rix David S | -- | None Available |
Source: Public Records
Mortgage History
| Date | Status | Borrower | Loan Amount |
|---|---|---|---|
| Open | Duenaz Dyllan | $196,037 | |
| Closed | Duenaz Dyllan | $10,000 | |
| Previous Owner | Weishaar Paul J | $137,464 |
Source: Public Records
Tax History Compared to Growth
Tax History
| Year | Tax Paid | Tax Assessment Tax Assessment Total Assessment is a certain percentage of the fair market value that is determined by local assessors to be the total taxable value of land and additions on the property. | Land | Improvement |
|---|---|---|---|---|
| 2025 | $6,141 | $106,000 | $0 | $0 |
| 2024 | $5,606 | $111,700 | $0 | $0 |
| 2023 | $3,629 | $99,000 | $0 | $0 |
| 2022 | $3,952 | $88,000 | $0 | $0 |
| 2021 | $3,037 | $80,900 | $0 | $0 |
| 2020 | $3,071 | $71,200 | $71,200 | $0 |
| 2019 | $3,016 | $62,000 | $0 | $0 |
| 2018 | $2,949 | $62,000 | $0 | $0 |
| 2017 | $1,870 | $56,600 | $0 | $0 |
| 2016 | $1,604 | $56,600 | $0 | $0 |
| 2015 | $1,574 | $50,200 | $50,200 | $0 |
| 2014 | $1,574 | $44,900 | $44,900 | $0 |
| 2013 | -- | $43,200 | $0 | $0 |
Source: Public Records
Map
Nearby Homes
- 1424 Hazelwood Ln
- 3321 Stone St
- 3214 Poplar St
- 1020 Sanborn St
- 3455 Gratiot Ave
- 3208 Mount Vernon Rd
- 3419 Riverside Dr
- 1202 Palmer Ct
- 2913 11th Ave
- 1531 Robinson St
- 1434 Schumaker St
- 1218 Garfield St
- 2812 19th Ave
- 3515 Strawberry Ln
- 1116 Hancock St
- 2857 Riverside Dr
- 2215 Hancock St
- 2400 Stone St Unit 2414
- 2419 Cherry St
- 909 Elmwood St
- 1444 Hazelwood Ln
- 3460 Appomattox Dr Unit 3462
- 0 Williamsburgh Dr Unit G31197150
- 3505 Williamsburg Dr
- 1438 Hazelwood Ln
- 0 Hazelwood Ln
- 1447 Devonshire Ln
- 1443 Devonshire Ln
- 1523 Hazelwood Ln Unit 1529-1531 Hazelwood
- 3515 Williamsburg Dr Unit 3517
- 3504 Williamsburg Dr
- 1432 Hazelwood Ln
- 1437 Devonshire Ln
- 3510 Williamsburg Dr Unit 3512
- 1433 Devonshire Ln
- 0 Williamsburg Dr
- 3519 Williamsburg Dr
- 3519 Williamsburg Dr Unit 3521
- 3519 Williamsburg Dr
- 1529 Hazelwood Ln Unit 1531