1444 Mello Ct Turlock, CA 95380
Turlock AreaEstimated Value: $450,283 - $481,000
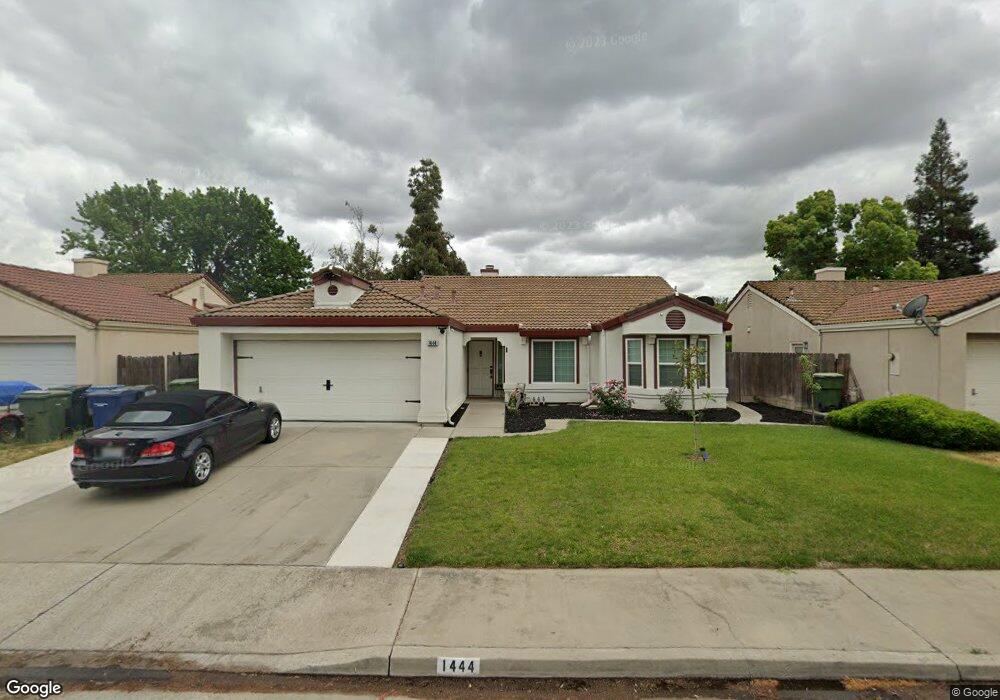
About This Home
This home is located at 1444 Mello Ct, Turlock, CA 95380 and is currently estimated at $460,571, approximately $337 per square foot. 1444 Mello Ct is a home located in Stanislaus County with nearby schools including Crowell Elementary School, Marvin A. Dutcher Middle School, and Turlock Junior High School.
Ownership History
We collect this data history from publicly available records. To have your information removed, we recommend requesting removal directly through your county’s website.
Purchase Details
Home Financials for this Owner
Home Financials are based on the most recent Mortgage that was taken out on this home.Purchase Details
Purchase History
We collect this data history from publicly available records. To have your information removed, we recommend requesting removal directly through your county’s website.
| Date | Buyer | Sale Price | Title Company |
|---|---|---|---|
| $340,000 | Old Republic Title Company | ||
| $111,000 | Fidelity National Title |
Mortgage History
We collect this data history from publicly available records. To have your information removed, we recommend requesting removal directly through your county’s website.
| Date | Status | Borrower | Loan Amount |
|---|---|---|---|
| Open | $347,820 | ||
| Previous Owner | $70,000 | ||
| Previous Owner | $50,000 |
Tax History
We collect this data history from publicly available records. To have your information removed, we recommend requesting removal directly through your county’s website.
| Year | Tax Paid | Tax Assessment Tax Assessment Total Assessment is a certain percentage of the fair market value that is determined by local assessors to be the total taxable value of land and additions on the property. | Land | Improvement |
|---|---|---|---|---|
| 2025 | $3,886 | $368,025 | $200,249 | $167,776 |
| 2024 | $3,813 | $360,810 | $196,323 | $164,487 |
| 2023 | $3,805 | $353,736 | $192,474 | $161,262 |
| 2022 | $3,756 | $346,800 | $188,700 | $158,100 |
| 2021 | $3,732 | $336,000 | $140,000 | $196,000 |
| 2020 | $1,871 | $174,009 | $45,563 | $128,446 |
| 2019 | $1,838 | $170,598 | $44,670 | $125,928 |
| 2018 | $1,835 | $167,254 | $43,795 | $123,459 |
| 2017 | $1,791 | $163,976 | $42,937 | $121,039 |
| 2016 | $1,687 | $160,762 | $42,096 | $118,666 |
| 2015 | $1,679 | $153,423 | $41,464 | $111,959 |
| 2014 | $1,663 | $150,418 | $40,652 | $109,766 |
Map
- 1400 N Tully Rd Unit 116
- 1400 N Tully Rd Unit 114
- 1400 N Tully Rd Unit 86
- 990 Hysell Ct
- 1820 Ogden Way
- 1186 Kay Cir
- 2230 Aspenwood Dr
- 2400 Fulkerth Rd
- 2450 Fulkerth Rd
- 1961 Nikki Ann Way
- 151 20th Century Blvd
- 500 N Tully Rd Unit 64
- 500 N Tully Rd Unit 39
- 500 N Tully Rd Unit 64
- 2147 Sorrel Dr
- 2081 Drew Ave
- 703 Flower St
- 2121 Typhoon Ct
- 2100 State St
- 1760 Valparaiso Dr
- 1424 Mello Ct
- 1279 Joett Dr
- 1289 Joett Dr
- 1411 Tramway Place
- 1464 Mello Ct
- 1421 Tramway Place
- 1299 Joett Dr
- 1427 Mello Ct
- 1269 Joett Dr
- 1447 Mello Ct
- 1431 Tramway Place
- 1484 Mello Ct
- 1441 Tramway Place
- 1420 Tramway Place
- 1440 Tramway Place
- 1504 Mello Ct
- 1249 Joett Dr
- 1400 Tramway Place
- 1440 Pavillion Way
- 1487 Mello Ct
Ask me questions while you tour the home.