Estimated Value: $247,000 - $267,000
2
Beds
2
Baths
1,534
Sq Ft
$169/Sq Ft
Est. Value
About This Home
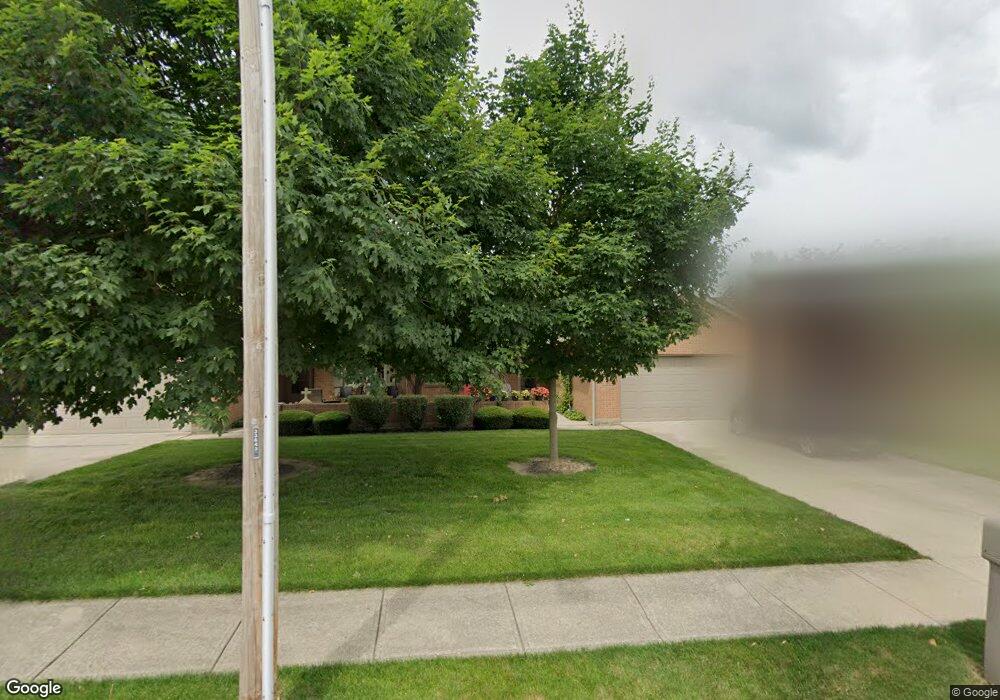
This home is located at 1444 Pavey Place Unit 3, Xenia, OH 45385 and is currently estimated at $259,494, approximately $169 per square foot. 1444 Pavey Place Unit 3 is a home located in Greene County with nearby schools including Xenia High School, Summit Academy Community School for Alternative Learners - Xenia, and Legacy Christian Academy.
Ownership History
Date
Name
Owned For
Owner Type
Purchase Details
Closed on
Mar 6, 2020
Sold by
Nickoson Gladys E
Bought by
Harkins Daniel C
Current Estimated Value
Purchase Details
Closed on
Oct 24, 2019
Sold by
Shanks Elana C and Preston Nedra A
Bought by
Nickson Joe C and Nickson Gladys E
Purchase Details
Closed on
Jul 24, 2013
Sold by
Glotfelter Thomas D and Glotfelter Irma E
Bought by
Glotfelter Irma E and Glotfelter Thomas D
Purchase Details
Closed on
Aug 17, 2007
Sold by
Mays Joe A and Mays Deloris Ann
Bought by
Glotfelter Thomas D and Glotfelter Irma E
Home Financials for this Owner
Home Financials are based on the most recent Mortgage that was taken out on this home.
Original Mortgage
$84,500
Interest Rate
7.87%
Mortgage Type
Unknown
Purchase Details
Closed on
Aug 15, 2002
Sold by
Davy Ethel G
Bought by
Mays Joe A and Mays Deloris Ann
Create a Home Valuation Report for This Property
The Home Valuation Report is an in-depth analysis detailing your home's value as well as a comparison with similar homes in the area
Home Values in the Area
Average Home Value in this Area
Purchase History
| Date | Buyer | Sale Price | Title Company |
|---|---|---|---|
| Harkins Daniel C | -- | None Available | |
| Nickson Joe C | $189,900 | None Available | |
| Glotfelter Irma E | -- | None Available | |
| Glotfelter Thomas D | $169,000 | Attorney | |
| Mays Joe A | $155,000 | -- |
Source: Public Records
Mortgage History
| Date | Status | Borrower | Loan Amount |
|---|---|---|---|
| Previous Owner | Glotfelter Thomas D | $84,500 |
Source: Public Records
Tax History Compared to Growth
Tax History
| Year | Tax Paid | Tax Assessment Tax Assessment Total Assessment is a certain percentage of the fair market value that is determined by local assessors to be the total taxable value of land and additions on the property. | Land | Improvement |
|---|---|---|---|---|
| 2024 | $2,684 | $74,170 | $8,750 | $65,420 |
| 2023 | $2,684 | $74,170 | $8,750 | $65,420 |
| 2022 | $2,566 | $61,220 | $8,750 | $52,470 |
| 2021 | $2,601 | $61,220 | $8,750 | $52,470 |
| 2020 | $2,982 | $61,220 | $8,750 | $52,470 |
| 2019 | $1,754 | $43,560 | $8,750 | $34,810 |
| 2018 | $1,761 | $43,560 | $8,750 | $34,810 |
| 2017 | $1,807 | $43,560 | $8,750 | $34,810 |
| 2016 | $1,808 | $43,830 | $8,750 | $35,080 |
| 2015 | $764 | $43,830 | $8,750 | $35,080 |
| 2014 | -- | $43,830 | $8,750 | $35,080 |
Source: Public Records
Map
Nearby Homes
- 1171 N Detroit St
- 1038 Frederick Dr
- 902 N Detroit St
- 878 N Detroit St
- 2018 Tahoe Dr
- 1815 Promenade Ln
- 1359 Eagles Way
- 1311 Eagles Way
- 493 Hollywood Blvd
- 499 Hollywood Blvd
- 1872 Harris Ln
- 1791 Palmer Ct
- 2094 Malibu Trail
- 659 N King St
- 965 Oak Dale Dr
- 1796 Palmer Ct
- 1802 Palmer Ct
- 1808 Palmer Ct
- 513 Redbud Ln
- 1814 Palmer Ct
- 1446 Pavey Place
- 1442 Pavey Place
- 1440 Pavey Place
- 1460 Pavey Place Unit 9
- 1462 Pavey Place Unit 10
- 1445 Pavey Place
- 1443 Pavey Place
- 1447 Pavey Place
- 1441 Pavey Place
- 1464 Pavey Place Unit 11
- 1461 Pavey Place
- 1463 Pavey Place Unit 13
- 1480 Pavey Place
- 1465 Pavey Place
- 153 Country Club Dr
- 224 Country Club Dr
- 169 Country Club Dr
- 1482 Pavey Place
- 1481 Pavey Place
- 183 Country Club Dr