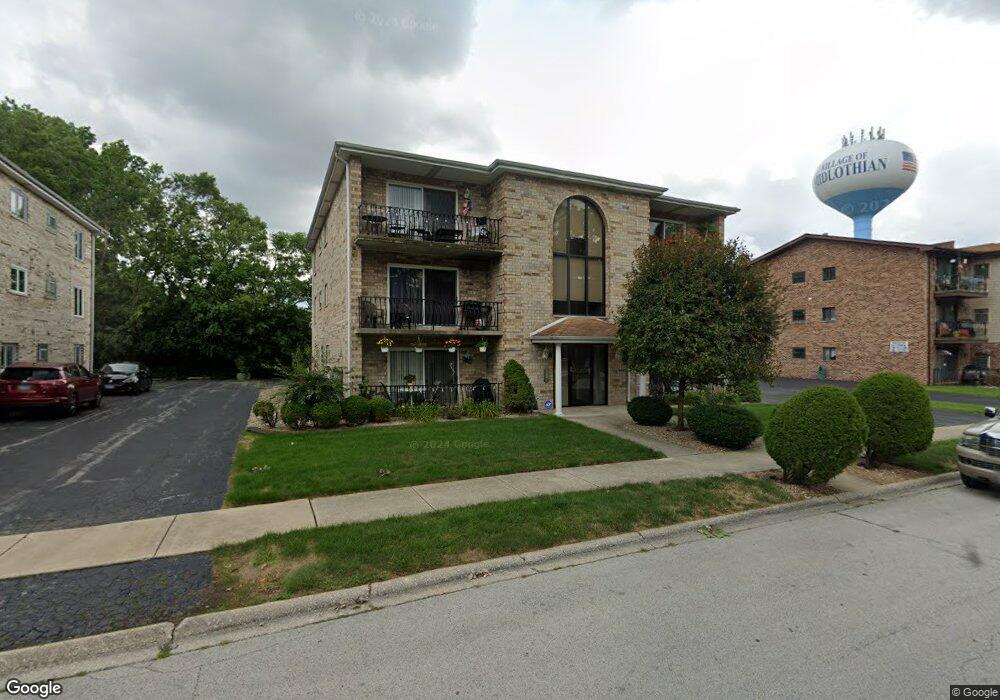
14441 Lamon Ave Unit 1S Midlothian, IL 60445
Estimated Value: $137,790 - $199,000
2
Beds
1
Bath
1,100
Sq Ft
$149/Sq Ft
Est. Value
About This Home
This home is located at 14441 Lamon Ave Unit 1S, Midlothian, IL 60445 and is currently estimated at $164,198, approximately $149 per square foot. 14441 Lamon Ave Unit 1S is a home located in Cook County with nearby schools including Kerkstra Elementary School, Jack Hille Middle School, and Oak Forest High School.
Ownership History
Date
Name
Owned For
Owner Type
Purchase Details
Closed on
Apr 25, 2005
Sold by
Bradley Martin J and Bradley Michaela L
Bought by
Johnson Dianne A
Current Estimated Value
Home Financials for this Owner
Home Financials are based on the most recent Mortgage that was taken out on this home.
Original Mortgage
$143,900
Outstanding Balance
$76,040
Interest Rate
6.05%
Mortgage Type
Fannie Mae Freddie Mac
Estimated Equity
$88,158
Purchase Details
Closed on
Apr 4, 2002
Sold by
Palos Bank & Trust Company
Bought by
Bradley Martin J and Deady Michaela L
Home Financials for this Owner
Home Financials are based on the most recent Mortgage that was taken out on this home.
Original Mortgage
$101,650
Interest Rate
7.18%
Purchase Details
Closed on
Oct 31, 1997
Sold by
Kaley Helen
Bought by
Palos Bank & Trust Company and Trust #1-4221
Create a Home Valuation Report for This Property
The Home Valuation Report is an in-depth analysis detailing your home's value as well as a comparison with similar homes in the area
Home Values in the Area
Average Home Value in this Area
Purchase History
| Date | Buyer | Sale Price | Title Company |
|---|---|---|---|
| Johnson Dianne A | $144,000 | Pntn | |
| Bradley Martin J | $107,000 | -- | |
| Palos Bank & Trust Company | -- | Lawyers Title Insurance Corp |
Source: Public Records
Mortgage History
| Date | Status | Borrower | Loan Amount |
|---|---|---|---|
| Open | Johnson Dianne A | $143,900 | |
| Previous Owner | Bradley Martin J | $101,650 |
Source: Public Records
Tax History Compared to Growth
Tax History
| Year | Tax Paid | Tax Assessment Tax Assessment Total Assessment is a certain percentage of the fair market value that is determined by local assessors to be the total taxable value of land and additions on the property. | Land | Improvement |
|---|---|---|---|---|
| 2024 | $2,614 | $10,606 | $922 | $9,684 |
| 2023 | $1,809 | $10,606 | $922 | $9,684 |
| 2022 | $1,809 | $7,324 | $762 | $6,562 |
| 2021 | $1,799 | $7,322 | $761 | $6,561 |
| 2020 | $1,823 | $7,322 | $761 | $6,561 |
| 2019 | $1,883 | $7,755 | $681 | $7,074 |
| 2018 | $1,843 | $7,755 | $681 | $7,074 |
| 2017 | $3,697 | $12,316 | $681 | $11,635 |
| 2016 | $3,341 | $10,293 | $601 | $9,692 |
| 2015 | $3,212 | $10,293 | $601 | $9,692 |
| 2014 | $3,138 | $10,293 | $601 | $9,692 |
| 2013 | $2,980 | $10,876 | $601 | $10,275 |
Source: Public Records
Map
Nearby Homes
- 14457 Lamon Ave Unit 3N
- 4653 146th St
- 14602 Kenton Ave
- 14603 Kenton Ave
- 14710 Kenton Ave
- 14704 Kenton Ave
- 14341 Kenton Ave
- 14840 Kilpatrick Ave Unit 604
- 14137 Kilpatrick Ave
- 14833 Kilpatrick Ave
- 14913 Sheila Ct
- 14815 Kenton Ave Unit 1
- 14317 Kilbourne Ave
- 5018 Midlothian Turnpike Unit 1009
- 14632 Kostner Ave
- 14926 Kenton Ave
- 14545 Kostner Ave
- 14244 Kostner Ave
- 14540 Kolin Ave
- 14305 Kostner Ave
- 14441 Lamon Ave Unit 3S
- 14441 Lamon Ave Unit 2S
- 14441 Lamon Ave Unit 3N
- 14441 Lamon Ave Unit 1N
- 14441 Lamon Ave Unit 2N
- 14431 Lamon Ave Unit 2N
- 14431 Lamon Ave Unit 1N
- 14431 Lamon Ave Unit 3S
- 14431 Lamon Ave
- 14431 Lamon Ave Unit 2S
- 14431 Lamon Ave Unit 1S
- 14431 Lamon Ave Unit 3N
- 14455 Lamon Ave Unit 102
- 14455 Lamon Ave Unit 1445510
- 14455 Lamon Ave Unit 1445530
- 14455 Lamon Ave Unit 1445510
- 14455 Lamon Ave Unit 1445530
- 14455 Lamon Ave Unit 1445520
- 14455 Lamon Ave Unit 1445520
- 14455 Lamon Ave Unit 3S