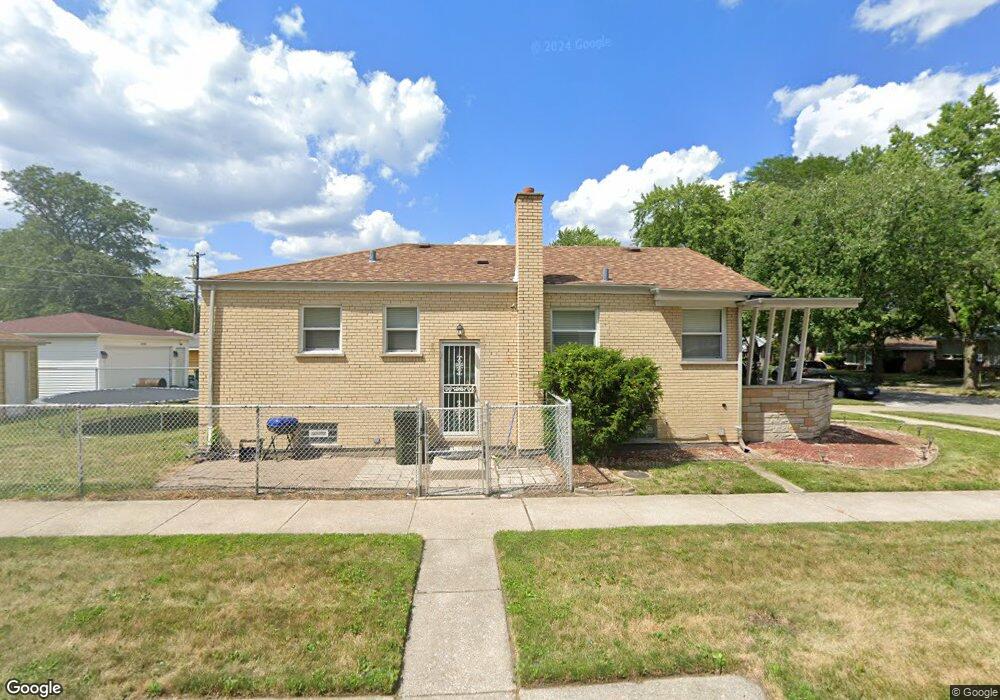
14446 Avalon Ave Dolton, IL 60419
Estimated Value: $156,000 - $224,000
3
Beds
2
Baths
1,030
Sq Ft
$174/Sq Ft
Est. Value
About This Home
This home is located at 14446 Avalon Ave, Dolton, IL 60419 and is currently estimated at $179,526, approximately $174 per square foot. 14446 Avalon Ave is a home located in Cook County with nearby schools including Berger-Vandenberg Elementary School, Creative Communications Academy, and School Of Fine Arts Academy.
Ownership History
Date
Name
Owned For
Owner Type
Purchase Details
Closed on
Apr 28, 2017
Sold by
Steele Antoinette and Bradley Antoinette
Bought by
Bonner Keiona
Current Estimated Value
Home Financials for this Owner
Home Financials are based on the most recent Mortgage that was taken out on this home.
Original Mortgage
$85,914
Outstanding Balance
$72,218
Interest Rate
4.5%
Mortgage Type
FHA
Estimated Equity
$107,308
Purchase Details
Closed on
Feb 10, 2011
Sold by
Beneficial Financial I Inc
Bought by
Steele Antoinette
Purchase Details
Closed on
Aug 24, 2010
Sold by
Price Rosetta C
Bought by
Beneficial Illinois Inc and Beneficial Mortgage Co Of Illinois
Purchase Details
Closed on
Sep 27, 1995
Sold by
Elingeleschmitt Herbert P and Elingelschmitt Janice M
Bought by
Financial Federal Trust & Svgs Bank
Home Financials for this Owner
Home Financials are based on the most recent Mortgage that was taken out on this home.
Original Mortgage
$74,100
Interest Rate
8%
Create a Home Valuation Report for This Property
The Home Valuation Report is an in-depth analysis detailing your home's value as well as a comparison with similar homes in the area
Home Values in the Area
Average Home Value in this Area
Purchase History
| Date | Buyer | Sale Price | Title Company |
|---|---|---|---|
| Bonner Keiona | $87,500 | None Available | |
| Steele Antoinette | $25,000 | None Available | |
| Beneficial Illinois Inc | -- | None Available | |
| Financial Federal Trust & Svgs Bank | $120,000 | -- |
Source: Public Records
Mortgage History
| Date | Status | Borrower | Loan Amount |
|---|---|---|---|
| Open | Bonner Keiona | $85,914 | |
| Previous Owner | Financial Federal Trust & Svgs Bank | $74,100 |
Source: Public Records
Tax History Compared to Growth
Tax History
| Year | Tax Paid | Tax Assessment Tax Assessment Total Assessment is a certain percentage of the fair market value that is determined by local assessors to be the total taxable value of land and additions on the property. | Land | Improvement |
|---|---|---|---|---|
| 2024 | $5,284 | $12,680 | $1,947 | $10,733 |
| 2023 | $3,018 | $12,680 | $1,947 | $10,733 |
| 2022 | $3,018 | $7,590 | $1,718 | $5,872 |
| 2021 | $2,933 | $7,589 | $1,718 | $5,871 |
| 2020 | $3,330 | $8,279 | $1,718 | $6,561 |
| 2019 | $2,641 | $7,051 | $1,603 | $5,448 |
| 2018 | $6,092 | $8,389 | $1,603 | $6,786 |
| 2017 | $3,445 | $8,389 | $1,603 | $6,786 |
| 2016 | $3,652 | $8,226 | $1,489 | $6,737 |
| 2015 | $3,450 | $8,226 | $1,489 | $6,737 |
| 2014 | $3,440 | $8,226 | $1,489 | $6,737 |
| 2013 | $3,372 | $8,541 | $1,489 | $7,052 |
Source: Public Records
Map
Nearby Homes
- 14405 Woodlawn Ave
- 14447 University Ave
- 14409 Kimbark Ave
- 14429 Minerva Ave
- 14534 Woodlawn Ave
- 14519 Kenwood Ave
- 14248 Avalon Ave
- 14301 Kimbark Ave
- 14417 Dorchester Ave
- 14238 Woodlawn Ave
- 14301 Kenwood Ave
- 14428 Dante Ave
- 14237 Minerva Ave
- 14622 Kenwood Ave
- 14635 Woodlawn Ave
- 14631 Kimbark Ave
- 14619 Minerva Ave
- 14320 Dobson Ave
- 14441 Dante Ave
- 14634 Kenwood Ave
- 14444 Avalon Ave
- 14440 Avalon Ave
- 14440 Avalon Ave
- 14500 Avalon Ave
- 14436 Avalon Ave
- 14447 Woodlawn Ave
- 14445 Woodlawn Ave
- 14504 Avalon Ave
- 14434S Avalon Ave
- 14434 Avalon Ave
- 14434 Avalon Ave
- 14501 Woodlawn Ave
- 14437 Woodlawn Ave
- 14447 Avalon Ave
- 14445 Avalon Ave
- 14508 Avalon Ave
- 14430 Avalon Ave
- 14505 Woodlawn Ave
- 14441 Avalon Ave