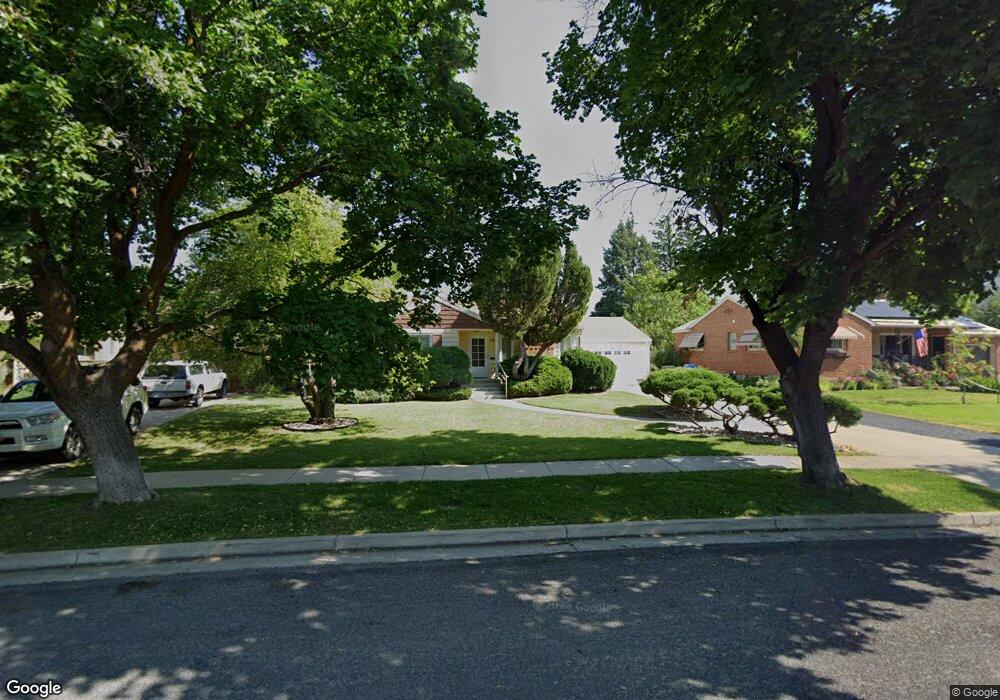
1445 Maple Dr Logan, UT 84321
Hillcrest NeighborhoodEstimated Value: $388,505 - $449,000
Studio
--
Bath
982
Sq Ft
$423/Sq Ft
Est. Value
About This Home
This home is located at 1445 Maple Dr, Logan, UT 84321 and is currently estimated at $415,376, approximately $422 per square foot. 1445 Maple Dr is a home with nearby schools including Hillcrest Elementary School, Mount Logan Middle School, and Logan High School.
Ownership History
Date
Name
Owned For
Owner Type
Purchase Details
Closed on
Jun 9, 2022
Sold by
Andres Lori E
Bought by
Rla & Associates Rentals Llc
Current Estimated Value
Purchase Details
Closed on
Aug 3, 2021
Sold by
Thorpe Doris B and Doris B Thorpe Living Trust
Bought by
Andres Lori E and Andres Robert L
Home Financials for this Owner
Home Financials are based on the most recent Mortgage that was taken out on this home.
Original Mortgage
$299,250
Interest Rate
2.3%
Mortgage Type
New Conventional
Create a Home Valuation Report for This Property
The Home Valuation Report is an in-depth analysis detailing your home's value as well as a comparison with similar homes in the area
Home Values in the Area
Average Home Value in this Area
Purchase History
| Date | Buyer | Sale Price | Title Company |
|---|---|---|---|
| Rla & Associates Rentals Llc | -- | None Listed On Document | |
| Andres Lori E | -- | Hickman Land Title Logan |
Source: Public Records
Mortgage History
| Date | Status | Borrower | Loan Amount |
|---|---|---|---|
| Previous Owner | Andres Lori E | $299,250 |
Source: Public Records
Tax History
| Year | Tax Paid | Tax Assessment Tax Assessment Total Assessment is a certain percentage of the fair market value that is determined by local assessors to be the total taxable value of land and additions on the property. | Land | Improvement |
|---|---|---|---|---|
| 2025 | $1,686 | $218,110 | $0 | $0 |
| 2023 | $1,823 | $217,685 | $0 | $0 |
| 2022 | $1,672 | $186,425 | $0 | $0 |
| 2021 | $1,555 | $267,930 | $65,000 | $202,930 |
| 2020 | $1,426 | $221,100 | $65,000 | $156,100 |
| 2019 | $1,491 | $221,100 | $65,000 | $156,100 |
| 2018 | $1,319 | $178,568 | $65,000 | $113,568 |
| 2017 | $1,132 | $81,070 | $0 | $0 |
| 2016 | $1,174 | $81,070 | $0 | $0 |
| 2015 | $1,175 | $81,070 | $0 | $0 |
| 2014 | $1,062 | $81,070 | $0 | $0 |
| 2013 | -- | $74,340 | $0 | $0 |
Source: Public Records
Map
Nearby Homes
- 825 N 1400 E
- 1374 Maple Dr
- 866 Hillcrest Ave
- 1535 Sumac Dr
- 1133 N 1520 E
- 1357 E 1220 N
- 1512 E 1260 N
- 1782 E 1250 N
- 1387 E 260 N
- 1535 E 1385 N
- 1341 N 1250 E Unit 41
- 1354 N 1250 E Unit 46
- 1374 E 260 N
- 1374 N 1250 E Unit 48
- 1454 N 1400 E
- 1450 N 1525 E
- 1440 N 1600 E
- 1336 E Talmage Ln Unit 38
- 1045 Fox Farm Rd
- 1405 N Aspen Dr
Your Personal Tour Guide
Ask me questions while you tour the home.