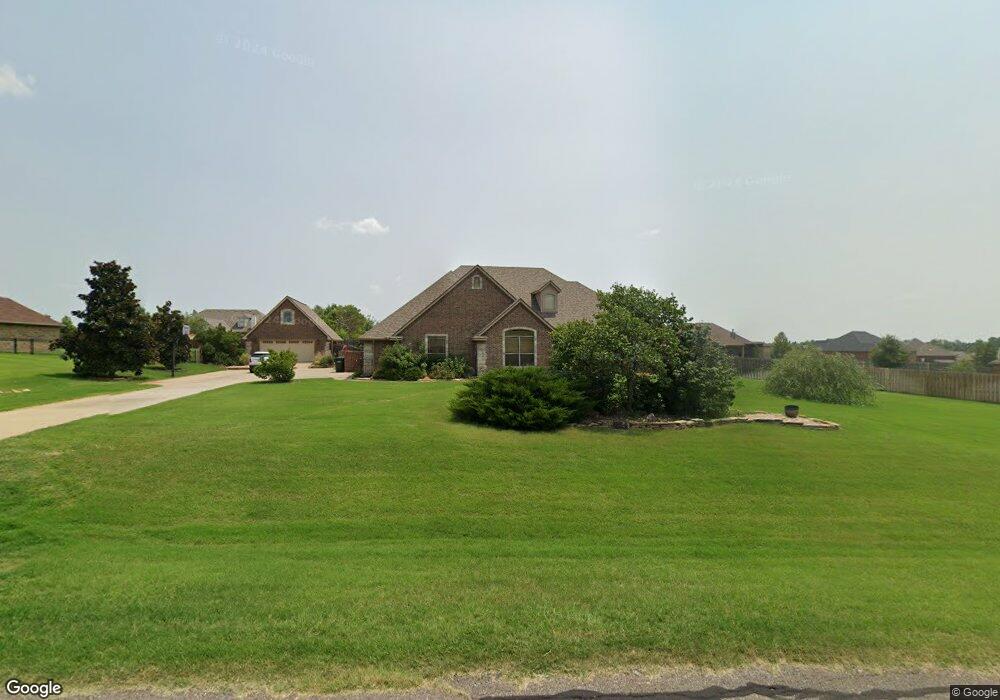
14450 Cottonwood Edmond, OK 73025
Navina NeighborhoodEstimated Value: $575,000 - $624,000
4
Beds
3
Baths
3,384
Sq Ft
$175/Sq Ft
Est. Value
About This Home
This home is located at 14450 Cottonwood, Edmond, OK 73025 and is currently estimated at $592,818, approximately $175 per square foot. 14450 Cottonwood is a home located in Logan County with nearby schools including Rose Union Elementary School, Deer Creek Middle School, and Deer Creek Intermediate School.
Ownership History
Date
Name
Owned For
Owner Type
Purchase Details
Closed on
May 11, 2012
Sold by
Turner Tommy and Turner Deanna
Bought by
Stratton Charri L and Stratton John S
Current Estimated Value
Home Financials for this Owner
Home Financials are based on the most recent Mortgage that was taken out on this home.
Original Mortgage
$100,000
Outstanding Balance
$69,038
Interest Rate
3.9%
Mortgage Type
New Conventional
Estimated Equity
$523,780
Purchase Details
Closed on
Jul 28, 2008
Sold by
Blue Ribbon Construction Llc
Bought by
Turner Tommy
Purchase Details
Closed on
Oct 11, 2007
Sold by
Antler Ridge Development
Bought by
Blue Ribbon Construction Llc
Home Financials for this Owner
Home Financials are based on the most recent Mortgage that was taken out on this home.
Original Mortgage
$214,310
Interest Rate
6.32%
Mortgage Type
Construction
Create a Home Valuation Report for This Property
The Home Valuation Report is an in-depth analysis detailing your home's value as well as a comparison with similar homes in the area
Home Values in the Area
Average Home Value in this Area
Purchase History
| Date | Buyer | Sale Price | Title Company |
|---|---|---|---|
| Stratton Charri L | $350,000 | Stewart Abstract & Title Of | |
| Turner Tommy | $330,000 | None Available | |
| Blue Ribbon Construction Llc | $35,000 | None Available |
Source: Public Records
Mortgage History
| Date | Status | Borrower | Loan Amount |
|---|---|---|---|
| Open | Stratton Charri L | $100,000 | |
| Previous Owner | Blue Ribbon Construction Llc | $214,310 |
Source: Public Records
Tax History Compared to Growth
Tax History
| Year | Tax Paid | Tax Assessment Tax Assessment Total Assessment is a certain percentage of the fair market value that is determined by local assessors to be the total taxable value of land and additions on the property. | Land | Improvement |
|---|---|---|---|---|
| 2025 | $5,525 | $49,063 | $5,098 | $43,965 |
| 2024 | $5,525 | $46,727 | $5,098 | $41,629 |
| 2023 | $5,525 | $44,502 | $5,098 | $39,404 |
| 2022 | $4,532 | $42,383 | $5,098 | $37,285 |
| 2021 | $4,390 | $41,751 | $5,098 | $36,653 |
| 2020 | $4,336 | $39,763 | $5,098 | $34,665 |
| 2019 | $4,393 | $39,763 | $5,098 | $34,665 |
| 2018 | $4,237 | $38,663 | $5,098 | $33,565 |
| 2017 | $4,309 | $39,042 | $5,098 | $33,944 |
| 2016 | $4,240 | $38,668 | $5,098 | $33,570 |
| 2014 | $4,024 | $37,711 | $3,376 | $34,335 |
| 2013 | $3,808 | $41,139 | $3,683 | $37,456 |
Source: Public Records
Map
Nearby Homes
- 14485 Old Barn Rd
- 14601 Rushing Ln
- 14474 Old Barn Rd
- HOLDEN Plan at Rush Creek
- IRVING Plan at Rush Creek
- 14401 Rushing Ln
- 13581 Hickory Way
- 14580 Rushing Ln
- 13601 Hickory Way
- 14291 Beaver Creek Rd
- 14281 Rushbrook Dr
- 20782 Rush Creek Rd
- 21004 Rush Creek Rd
- 21200 Rush Creek Rd
- 20787 Rush Creek Rd
- 20715 Rush Creek Rd
- 21346 Rush Creek Rd
- 21017 Rush Creek Rd
- 20720 Rush Creek Rd
- 20866 Rush Creek Rd
- 14474 Cottonwood Dr
- 14424 Cottonwood
- 14455 Old Barn Rd
- 14451 Cottonwood
- 14421 Old Barn Rd
- 14425 Cottonwood
- 14475 Cottonwood
- 14504 Cottonwood
- 14400 Cottonwood
- 14505 Cottonwood
- 14401 Cottonwood
- 14444 Old Barn Rd
- 14515 Old Barn Rd
- 14383 Old Barn Rd
- 14404 Old Barn Rd
- 14544 Cottonwood
- 14374 Cottonwood
- 14514 Old Barn Rd
- 14373 Cottonwood
- 14371 Leaning Willow