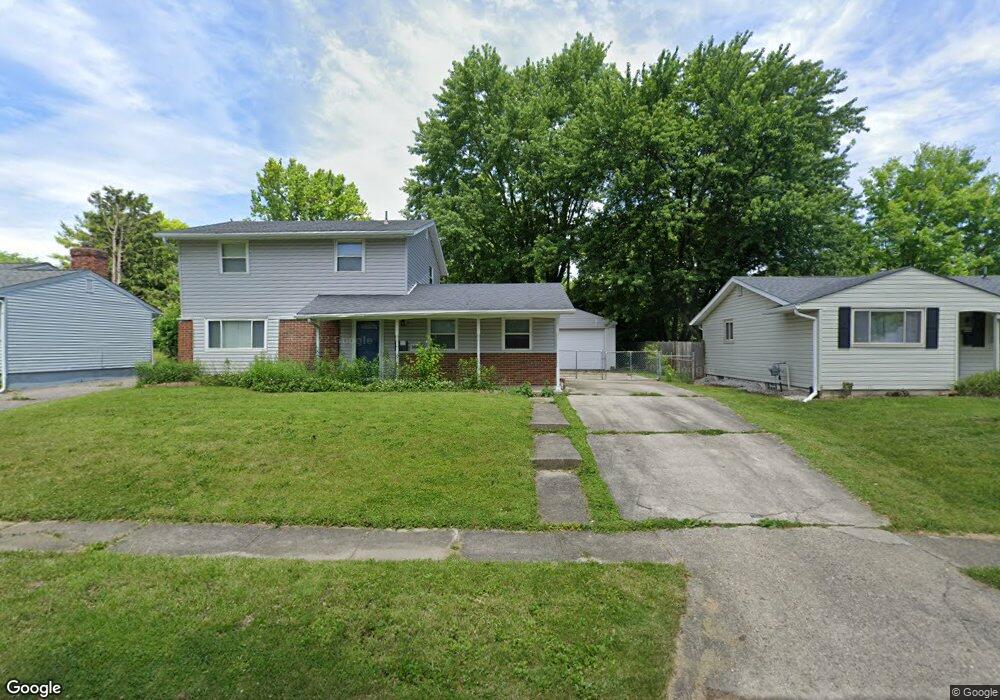
1446 Burnley Square S Columbus, OH 43229
Devonshire NeighborhoodEstimated Value: $236,000 - $267,000
3
Beds
2
Baths
1,376
Sq Ft
$186/Sq Ft
Est. Value
About This Home
This home is located at 1446 Burnley Square S, Columbus, OH 43229 and is currently estimated at $255,899, approximately $185 per square foot. 1446 Burnley Square S is a home located in Franklin County with nearby schools including Devonshire Alternative Elementary School, Woodward Park Middle School, and Beechcroft High School.
Ownership History
Date
Name
Owned For
Owner Type
Purchase Details
Closed on
Jun 23, 2003
Sold by
Leahy David J and Leahy Kathleen
Bought by
Laux Teresa L
Current Estimated Value
Purchase Details
Closed on
Aug 30, 2001
Sold by
Leahy David J
Bought by
Leahy David J and Leahy Kathleen
Home Financials for this Owner
Home Financials are based on the most recent Mortgage that was taken out on this home.
Original Mortgage
$80,350
Interest Rate
6.97%
Purchase Details
Closed on
May 28, 1997
Sold by
Stevens Russell L and Stevens Suzanne J
Bought by
Leahy David J
Home Financials for this Owner
Home Financials are based on the most recent Mortgage that was taken out on this home.
Original Mortgage
$84,550
Interest Rate
8.27%
Purchase Details
Closed on
Apr 1, 1987
Purchase Details
Closed on
Nov 1, 1978
Create a Home Valuation Report for This Property
The Home Valuation Report is an in-depth analysis detailing your home's value as well as a comparison with similar homes in the area
Home Values in the Area
Average Home Value in this Area
Purchase History
| Date | Buyer | Sale Price | Title Company |
|---|---|---|---|
| Laux Teresa L | $111,000 | Metropolitan Title Agency In | |
| Leahy David J | -- | -- | |
| Leahy David J | $89,000 | Capital Title | |
| -- | $55,000 | -- | |
| -- | $41,800 | -- |
Source: Public Records
Mortgage History
| Date | Status | Borrower | Loan Amount |
|---|---|---|---|
| Previous Owner | Leahy David J | $80,350 | |
| Previous Owner | Leahy David J | $84,550 |
Source: Public Records
Tax History Compared to Growth
Tax History
| Year | Tax Paid | Tax Assessment Tax Assessment Total Assessment is a certain percentage of the fair market value that is determined by local assessors to be the total taxable value of land and additions on the property. | Land | Improvement |
|---|---|---|---|---|
| 2024 | $3,583 | $79,840 | $17,850 | $61,990 |
| 2023 | $3,537 | $79,835 | $17,850 | $61,985 |
| 2022 | $2,476 | $47,740 | $13,650 | $34,090 |
| 2021 | $2,480 | $47,740 | $13,650 | $34,090 |
| 2020 | $2,484 | $47,740 | $13,650 | $34,090 |
| 2019 | $2,302 | $37,940 | $10,920 | $27,020 |
| 2018 | $2,101 | $37,940 | $10,920 | $27,020 |
| 2017 | $2,300 | $37,940 | $10,920 | $27,020 |
| 2016 | $2,099 | $31,680 | $8,300 | $23,380 |
| 2015 | $1,905 | $31,680 | $8,300 | $23,380 |
| 2014 | $1,910 | $31,680 | $8,300 | $23,380 |
| 2013 | $1,046 | $35,175 | $9,205 | $25,970 |
Source: Public Records
Map
Nearby Homes
- 6035 Karl Rd
- 1549 Alpine Dr
- 5990 Ambleside Dr
- 1288 Oakfield Dr N
- 1390 E Dublin Granville Rd
- 6189 Northgap Dr
- 1171 Newbury Dr
- 6211 Parkdale Dr
- 1268 Kildale Ct
- 6407 Faircrest Rd
- 6342 Bellmeadow Dr
- 1752 Pine Tree St S Unit H
- 1743 Pine Tree St N Unit A
- 6458 Faircrest Rd
- 1492 Cottonwood Dr
- 1687 Brookfield Square S
- 1409 Bosworth Place
- 1421 Bosworth Place
- 6407 Skywae Dr
- 6019 Beechcroft Rd
- 1434 Burnley Square S
- 1452 Burnley Square S
- 1435 Burnley Ct
- 1428 Burnley Square S
- 1441 Burnley Ct
- 1466 Burnley Square S
- 1427 Burnley Ct
- 6075 Burnley Square E
- 1451 Burnley Square S
- 1420 Burnley Square S
- 1431 Burnley Square S
- 6081 Burnley Square E
- 1457 Burnley Square S
- 1421 Burnley Ct
- 1444 Burnley Ct
- 1425 Burnley Square S
- 1469 Burnley Square S
- 6087 Burnley Square E
- 1414 Burnley Square S
- 1415 Burnley Ct