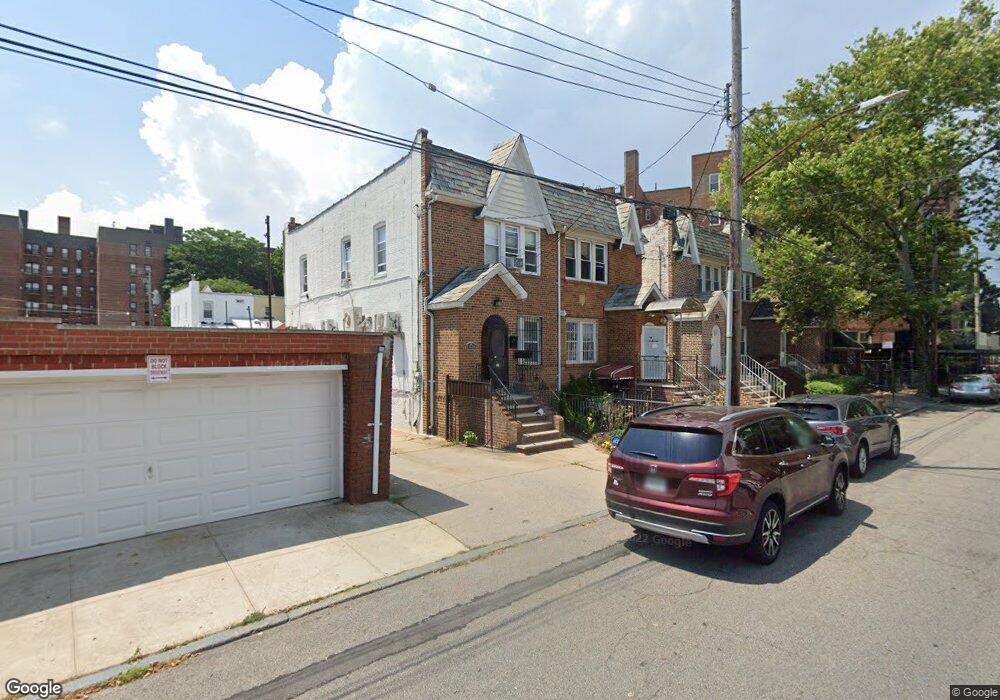
1446 E 37th St Brooklyn, NY 11234
Marine Park NeighborhoodEstimated Value: $698,000 - $948,000
Studio
--
Bath
2,088
Sq Ft
$401/Sq Ft
Est. Value
About This Home
This home is located at 1446 E 37th St, Brooklyn, NY 11234 and is currently estimated at $836,959, approximately $400 per square foot. 1446 E 37th St is a home located in Kings County with nearby schools including P.S. 119 Amersfort, Andries Hudde School, and Mesivta Tiferes Yisroel.
Ownership History
Date
Name
Owned For
Owner Type
Purchase Details
Closed on
Apr 11, 2016
Sold by
Bhoorasingh Dulcie S
Bought by
Kazi Tahamina
Current Estimated Value
Home Financials for this Owner
Home Financials are based on the most recent Mortgage that was taken out on this home.
Original Mortgage
$388,000
Outstanding Balance
$308,242
Interest Rate
3.68%
Mortgage Type
Purchase Money Mortgage
Estimated Equity
$528,717
Purchase Details
Closed on
Sep 29, 2004
Sold by
Charles Yves
Bought by
Bhoorasingh Dulcie S and Bhoorasingh Stephan
Home Financials for this Owner
Home Financials are based on the most recent Mortgage that was taken out on this home.
Original Mortgage
$443,000
Interest Rate
5.8%
Mortgage Type
Purchase Money Mortgage
Purchase Details
Closed on
Oct 15, 1998
Sold by
Chen Raymond Wei Ming
Bought by
Charles Yves and Charles Gerard J
Home Financials for this Owner
Home Financials are based on the most recent Mortgage that was taken out on this home.
Original Mortgage
$174,150
Interest Rate
6.67%
Mortgage Type
FHA
Create a Home Valuation Report for This Property
The Home Valuation Report is an in-depth analysis detailing your home's value as well as a comparison with similar homes in the area
Home Values in the Area
Average Home Value in this Area
Purchase History
| Date | Buyer | Sale Price | Title Company |
|---|---|---|---|
| Kazi Tahamina | $486,000 | -- | |
| Bhoorasingh Dulcie S | $443,000 | -- | |
| Charles Yves | $190,500 | Chicago Title Insurance Co |
Source: Public Records
Mortgage History
| Date | Status | Borrower | Loan Amount |
|---|---|---|---|
| Open | Kazi Tahamina | $388,000 | |
| Previous Owner | Bhoorasingh Dulcie S | $443,000 | |
| Previous Owner | Charles Yves | $174,150 |
Source: Public Records
Tax History
| Year | Tax Paid | Tax Assessment Tax Assessment Total Assessment is a certain percentage of the fair market value that is determined by local assessors to be the total taxable value of land and additions on the property. | Land | Improvement |
|---|---|---|---|---|
| 2025 | $6,475 | $60,240 | $9,480 | $50,760 |
| 2024 | $6,475 | $50,160 | $9,480 | $40,680 |
| 2023 | $6,548 | $60,840 | $9,480 | $51,360 |
| 2022 | $6,150 | $49,800 | $9,480 | $40,320 |
| 2021 | $6,332 | $48,360 | $9,480 | $38,880 |
| 2020 | $2,961 | $47,160 | $9,480 | $37,680 |
| 2019 | $5,571 | $47,160 | $9,480 | $37,680 |
| 2018 | $5,417 | $28,033 | $7,407 | $20,626 |
| 2017 | $5,178 | $26,872 | $8,056 | $18,816 |
| 2016 | $4,937 | $26,247 | $8,344 | $17,903 |
| 2015 | $2,838 | $24,762 | $9,359 | $15,403 |
| 2014 | $2,838 | $23,361 | $9,507 | $13,854 |
Source: Public Records
Map
Nearby Homes
- 3626 Kings Hwy
- 3626 Kings Hwy Unit 6C
- 3524 Avenue M
- 1217 E 36th St
- 1345 E 38th St
- 1344 E 35th St
- 1328 E 35th St
- 1443 E 35th St
- 1127 E 36th St
- 2109 New York Ave Unit 2111
- 1513 Kimball St
- 1327 E 34th St
- 2031 New York Ave
- 1992 New York Ave
- 1569 E 34th St
- 4306 Avenue M
- 3117 Kings Hwy
- 2020 E 41st St Unit 2B
- 2020 E 41 St Unit 6J
- 2020 E 41st St Unit 1-C
- 1446 1446 East 37 Street St
- 1446 E East 37 St
- 1444 E 37th St
- 1440 E 37th St
- 3619 Avenue M
- 3617 Avenue M
- 1438 E 37th St
- 3621 Avenue M
- 3615 Avenue M
- 3623 Avenue M
- 3613 Avenue M
- 1434 E 37th St
- 3609 Avenue M
- 1283 E 36th St
- 1283 E 36th St Unit Building
- 1281 E 36th St
- 1279 E 36th St
- 3607 Avenue M
- 3605 Avenue M
- 3701 Avenue M
Your Personal Tour Guide
Ask me questions while you tour the home.