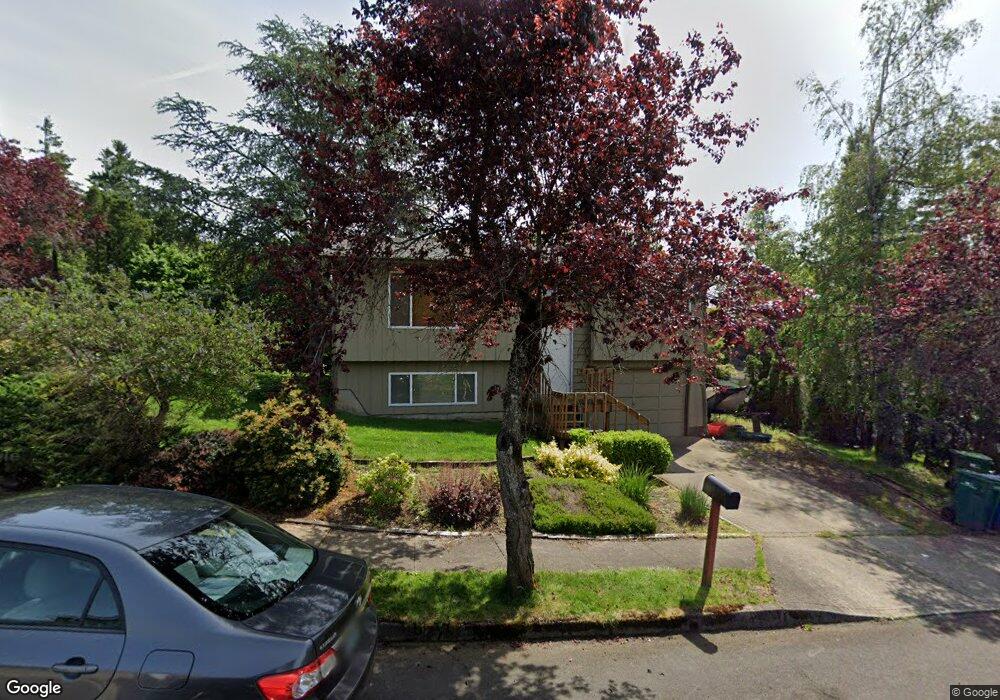
1446 SW 23rd Ct Gresham, OR 97080
Gresham Butte NeighborhoodEstimated Value: $337,000 - $431,000
3
Beds
2
Baths
1,386
Sq Ft
$289/Sq Ft
Est. Value
About This Home
This home is located at 1446 SW 23rd Ct, Gresham, OR 97080 and is currently estimated at $400,042, approximately $288 per square foot. 1446 SW 23rd Ct is a home located in Multnomah County with nearby schools including Dexter McCarty Middle School, Gresham High School, and Portland Adventist Elementary School.
Ownership History
Date
Name
Owned For
Owner Type
Purchase Details
Closed on
Apr 10, 2015
Sold by
Hennegan Yelena M
Bought by
Hennegan Michael S
Current Estimated Value
Purchase Details
Closed on
Jan 25, 2000
Sold by
Browning James B
Bought by
Hennegan Michael S and Hennegan Yelena M
Home Financials for this Owner
Home Financials are based on the most recent Mortgage that was taken out on this home.
Original Mortgage
$120,000
Interest Rate
7.87%
Mortgage Type
Balloon
Purchase Details
Closed on
Dec 14, 1998
Sold by
Campbell Robin J and Campbell Lynne A
Bought by
Browning James B and Browning Melody L
Home Financials for this Owner
Home Financials are based on the most recent Mortgage that was taken out on this home.
Original Mortgage
$100,000
Interest Rate
6.86%
Mortgage Type
Purchase Money Mortgage
Create a Home Valuation Report for This Property
The Home Valuation Report is an in-depth analysis detailing your home's value as well as a comparison with similar homes in the area
Home Values in the Area
Average Home Value in this Area
Purchase History
| Date | Buyer | Sale Price | Title Company |
|---|---|---|---|
| Hennegan Michael S | -- | None Available | |
| Hennegan Michael S | $135,000 | Ticor Title Insurance | |
| Browning James B | $131,000 | Chicago Title Insurance Co |
Source: Public Records
Mortgage History
| Date | Status | Borrower | Loan Amount |
|---|---|---|---|
| Closed | Hennegan Michael S | $120,000 | |
| Previous Owner | Browning James B | $100,000 |
Source: Public Records
Tax History
| Year | Tax Paid | Tax Assessment Tax Assessment Total Assessment is a certain percentage of the fair market value that is determined by local assessors to be the total taxable value of land and additions on the property. | Land | Improvement |
|---|---|---|---|---|
| 2025 | $4,345 | $213,510 | -- | -- |
| 2024 | $4,159 | $207,300 | -- | -- |
| 2023 | $3,789 | $201,270 | $0 | $0 |
| 2022 | $3,684 | $195,410 | $0 | $0 |
| 2021 | $3,591 | $189,720 | $0 | $0 |
| 2020 | $3,379 | $184,200 | $0 | $0 |
| 2019 | $3,290 | $178,840 | $0 | $0 |
| 2018 | $3,137 | $173,640 | $0 | $0 |
| 2017 | $3,010 | $168,590 | $0 | $0 |
| 2016 | $2,654 | $163,680 | $0 | $0 |
Source: Public Records
Map
Nearby Homes
- 2520 SW Towle Ave
- 1441 SW 23rd Ct
- 1261 SW Binford Lake Pkwy
- 1421 SW Binford Lake Pkwy
- 1278 SW 27th Ct
- 1859 SW Angeline Ave
- 1333 SW 19th Dr
- 1488 SW 17th Ct
- 3120 SW Orchard Place
- 1320 SW 31st St
- 1829 SW 17th St
- 1960 SW 13th Ct
- 1744 SW Battaglia Ave
- 2791 SW Myers Dr
- 1175 SW Chastain Dr
- 1963 SW Myers Place
- 3506 SW Battaglia Ave
- 3512 SW Battaglia Ave
- 3536 SW Battaglia Ave
- 3503 SW Battaglia Ave
- 1438 SW 23rd Ct
- 1452 SW 23rd Ct
- 2374 SW Towle Ave
- 2386 SW Towle Ave
- 1451 SW 23rd Ct
- 1445 SW 23rd Ct
- 1427 SW 23rd Ct
- 1432 SW 23rd Ct
- 1459 SW 23rd Ct
- 1443 SW 23rd Ct
- 2400 SW Towle Ave
- 1439 SW 23rd Ct
- 1430 SW 23 (Do Not Call)
- 1430 SW 23rd Ct Unit 1
- 1430 SW 23rd Ct
- 1488 SW Binford Lake Pkwy
- 1486 SW Binford Lake Pkwy
- 1474 SW Binford Lake Pkwy
- 1482 SW Binford Lake Pkwy
- 1403 SW 23rd Ct
Your Personal Tour Guide
Ask me questions while you tour the home.