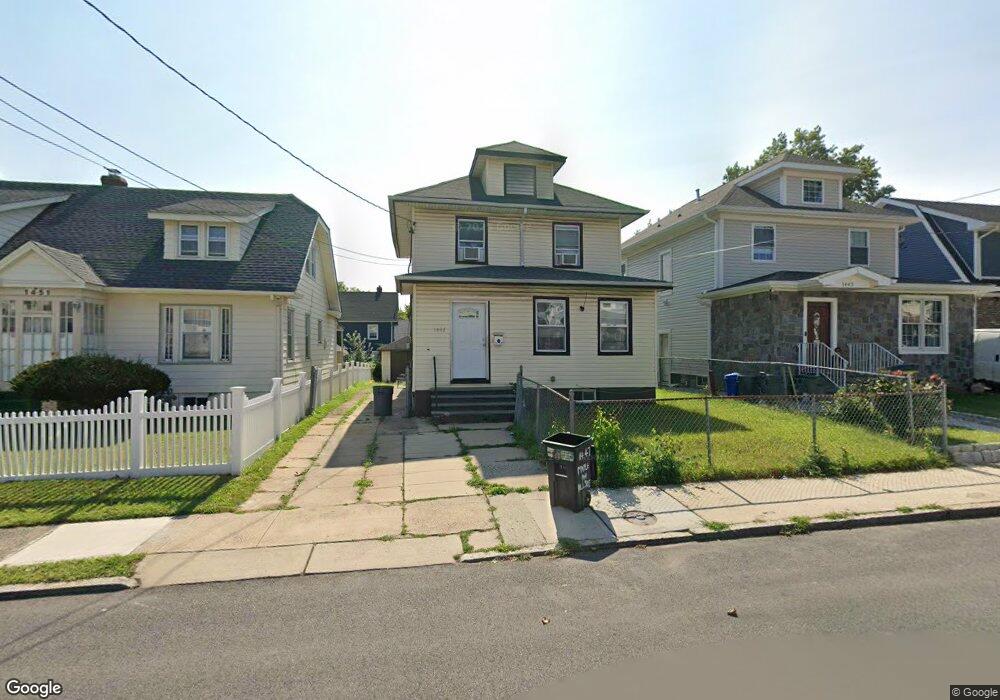
1447 Maple Ave Hillside, NJ 07205
Estimated Value: $378,000 - $485,000
Studio
--
Bath
1,352
Sq Ft
$324/Sq Ft
Est. Value
About This Home
This home is located at 1447 Maple Ave, Hillside, NJ 07205 and is currently estimated at $437,896, approximately $323 per square foot. 1447 Maple Ave is a home located in Union County with nearby schools including Abram P. Morris-Saybrook Elementary School, Ola Edwards Community School, and Hurden Looker School.
Ownership History
Date
Name
Owned For
Owner Type
Purchase Details
Closed on
Apr 2, 2015
Sold by
Ogbemudia Esohe
Bought by
Okundaye Moriamo
Current Estimated Value
Purchase Details
Closed on
Aug 15, 2011
Sold by
Okundaye Moriamo and Ogbemudia Esohe
Bought by
Okundaye Moriamo and Ogbemudia Esohe
Purchase Details
Closed on
Jun 28, 2007
Sold by
Saka Khadija and Saka Kofi
Bought by
Okundaye Mariamo and Ogbemudia Esohe
Home Financials for this Owner
Home Financials are based on the most recent Mortgage that was taken out on this home.
Original Mortgage
$264,120
Outstanding Balance
$164,911
Interest Rate
6.48%
Mortgage Type
New Conventional
Estimated Equity
$272,985
Purchase Details
Closed on
Oct 22, 1999
Sold by
Mcburney Barry A and Mcburney Janet T
Bought by
Saka Khadija
Home Financials for this Owner
Home Financials are based on the most recent Mortgage that was taken out on this home.
Original Mortgage
$100,000
Interest Rate
7.76%
Create a Home Valuation Report for This Property
The Home Valuation Report is an in-depth analysis detailing your home's value as well as a comparison with similar homes in the area
Home Values in the Area
Average Home Value in this Area
Purchase History
We collect this data history from publicly available records. To have your information removed, we recommend requesting removal directly through your county’s website.
| Date | Buyer | Sale Price | Title Company |
|---|---|---|---|
| Okundaye Moriamo | -- | None Available | |
| Okundaye Moriamo | -- | Transtar National Title | |
| Okundaye Mariamo | $284,000 | Chicago Title Insurance Co | |
| Saka Khadija | $112,000 | -- |
Source: Public Records
Mortgage History
We collect this data history from publicly available records. To have your information removed, we recommend requesting removal directly through your county’s website.
| Date | Status | Borrower | Loan Amount |
|---|---|---|---|
| Open | Okundaye Mariamo | $264,120 | |
| Previous Owner | Saka Khadija | $100,000 |
Source: Public Records
Tax History
| Year | Tax Paid | Tax Assessment Tax Assessment Total Assessment is a certain percentage of the fair market value that is determined by local assessors to be the total taxable value of land and additions on the property. | Land | Improvement |
|---|---|---|---|---|
| 2025 | $8,501 | $103,000 | $44,000 | $59,000 |
| 2024 | $8,253 | $103,000 | $44,000 | $59,000 |
| 2023 | $8,253 | $103,000 | $44,000 | $59,000 |
| 2022 | $8,177 | $103,000 | $44,000 | $59,000 |
| 2021 | $8,124 | $103,000 | $44,000 | $59,000 |
| 2020 | $8,076 | $103,000 | $44,000 | $59,000 |
| 2019 | $7,920 | $103,000 | $44,000 | $59,000 |
| 2018 | $7,840 | $103,000 | $44,000 | $59,000 |
| 2017 | $7,793 | $103,000 | $44,000 | $59,000 |
| 2016 | $7,784 | $103,000 | $44,000 | $59,000 |
| 2015 | $7,715 | $103,000 | $44,000 | $59,000 |
| 2014 | $7,593 | $103,000 | $44,000 | $59,000 |
Source: Public Records
Map
Nearby Homes
- 1466 Center St
- 1406 Maple Ave
- 1439 Compton Terrace
- 1451 Bond St
- 1414 Boa Place Unit 2
- 1504 Munn Ave
- 75 Hillside Ave
- 142 Bailey Ave
- 1444 N Broad St
- 207 Williamson Ave
- 38 Williamson Ave
- 1594 Maple Ave
- 1318 State St
- 29 Long Ave
- 315 Winans Ave
- 1603 Bayview Ave
- 52 Hollywood Ave
- 236-238 Keer Ave
- 1573 Wyndmoor Ave
- 1602 Bayview Ave
- 1443 Maple Ave
- 1439 Maple Ave
- 1451 Maple Ave
- 146 W Mertz Ave
- 1435 Maple Ave
- 142 W Mertz Ave
- 1431 Maple Ave
- 1442 Maple Ave
- 1446 Maple Ave
- 1438 Maple Ave
- 1457 Maple Ave
- 1448 Maple Ave
- 1436 Maple Ave
- 1452 Maple Ave
- 1432 Maple Ave
- 145 W Mertz Ave
- 1463 Maple Ave
- 1456 Maple Ave
- 1430 Maple Ave
- 1458 Maple Ave
Your Personal Tour Guide
Ask me questions while you tour the home.