M
Landlord's Agent in 2014
Malarie Johnson
Ih Sfr Pm LLC
(480) 499-3800
Estimated Value: $312,105 - $410,000
Lease this home and get more from Invitation Homes professional property management. This home comes fully loaded with quality amenities, must-have services, high-end tech and ProCare® professional maintenance. Your estimated total monthly payment is $1984.90. That covers your base rent, $1925.00 + our required services designed to make your life easier: Air Filter Delivery Fee ($9.95), Smart Home with video doorbell ($40), and Utility Billing Service Fee ($9.95). Base rent varies based on selected lease term.
Limited time offer: Receive $750 off your first full month’s base rent with a 24-month lease, or $500 off on leases shorter than 24 months, plus a $200 DoorDash gift card. This offer is valid on select homes with an approved application. Pricing and promotions are subject to change at any time at our sole discretion. For a detailed price breakdown, please refer to individual listings. Gift cards will be delivered via email within 30 days of move-in.
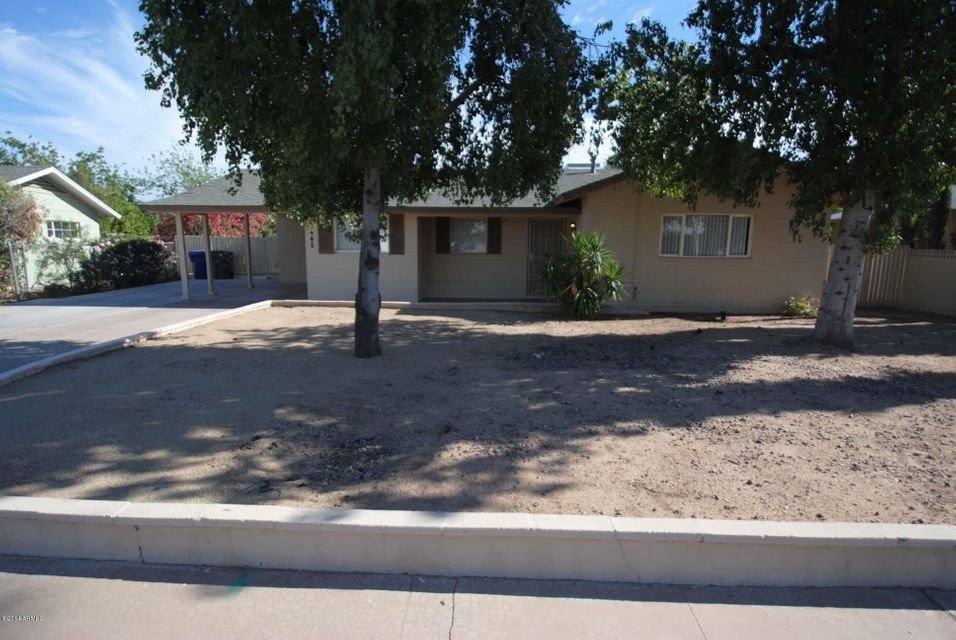
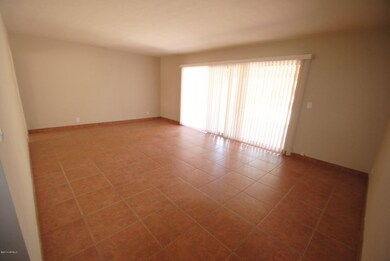
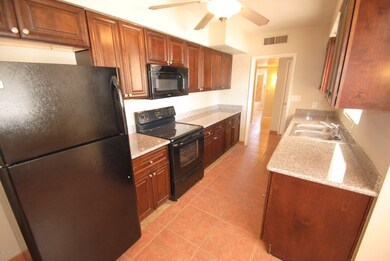
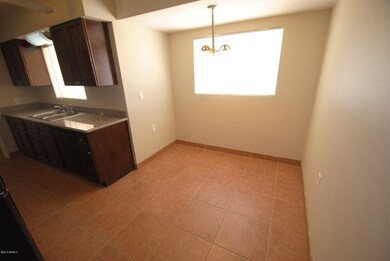
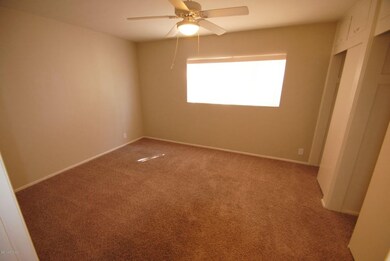
Here's a house you can grow with. You’ll get the room you need to step into the life you deserve. This place has a lot of space but that's not all. The living area is sure to catch your eye with tile flooring. Pull your friends into this breathtaking kitchen and recreate tasty treats from your favorite baking show! Your guests are sure to compliment the granite countertops, stainless steel appliances and high-end finishes. The fenced backyard features a patio, perfect for enjoying after-dinner conversations or simply relaxing in your favorite chair while taking in the view. Apply online today!
At Invitation Homes, we offer pet-friendly, yard-having homes for lease with Smart Home technology in awesome neighborhoods across the country. Live in a great house without the headache and long-term commitment of owning. Discover your dream home with Invitation Homes.
Our Lease Easy bundle – which includes Smart Home, Air Filter Delivery, and Utilities Management – is a key part of your worry-free leasing lifestyle. These services are required by your lease at an additional monthly cost. Monthly fees for pets and pools may also apply.
Home Features and Amenities: Air Conditioning, Breakfast Nook, Fenced Yard, Granite Countertops, Long Lease Terms, Patio, Pet Friendly, Primary Bedroom on Main, Single Story House, Smart Home, Stainless Steel Appliances, Tile, Walk in Closet, W/D Hookups, and professionally managed by Invitation Homes.
Invitation Homes is an equal housing lessor under the FHA. Applicable local, state and federal laws may apply. Additional terms and conditions apply. This listing is not an offer to rent. You must submit additional information including an application to rent and an application fee. All leasing information is believed to be accurate, but changes may have occurred since photographs were taken and square footage is estimated. Furthermore, prices and dates may change without notice. See InvitationHomes website for more information.
Beware of scams: Employees of Invitation Homes will never ask you for your username and password. Invitation Homes does not advertise on Craigslist, Social Serve, etc. We own our homes; there are no private owners. All funds to lease with Invitation Homes are paid directly through our website, never through wire transfer or payment app like Zelle, Pay Pal, or Cash App.
For more info, please submit an inquiry for this home. Applications are subject to our qualification requirements. Additional terms and conditions apply. CONSENT TO CALLS & TEXT MESSAGING: By entering your contact information, you expressly consent to receive emails, calls, and text messages from Invitation Homes including by autodialer, prerecorded or artificial voice and including marketing communications. Msg & Data rates may apply. You also agree to our Terms of Use and our Privacy Policy.
Last Agent to Rent the Property
Ih Sfr Pm LLC License #BR632409000 Listed on: 04/11/2014
| Date | Buyer | Sale Price | Title Company |
|---|---|---|---|
| 2017 2 Ih Borrower Lp | -- | None Available | |
| Thr Phoenix Lp | $91,600 | Fidelity National Title Agen |
| Date | Status | Borrower | Loan Amount |
|---|---|---|---|
| Open | 2017 2 Ih Borrower Lp | $865,027,000 |
| Date | Event | Price | List to Sale | Price per Sq Ft |
|---|---|---|---|---|
| 01/11/2026 01/11/26 | Off Market | $1,925 | -- | -- |
| 12/04/2025 12/04/25 | Price Changed | $1,925 | -1.0% | $1 / Sq Ft |
| 11/18/2025 11/18/25 | Price Changed | $1,945 | -2.5% | $1 / Sq Ft |
| 11/14/2025 11/14/25 | Price Changed | $1,995 | -2.4% | $1 / Sq Ft |
| 11/07/2025 11/07/25 | Price Changed | $2,045 | -2.6% | $1 / Sq Ft |
| 11/03/2025 11/03/25 | Price Changed | $2,099 | -5.0% | $1 / Sq Ft |
| 10/14/2025 10/14/25 | For Rent | $2,210 | +105.6% | -- |
| 05/13/2014 05/13/14 | Rented | $1,075 | 0.0% | -- |
| 04/28/2014 04/28/14 | Under Contract | -- | -- | -- |
| 04/11/2014 04/11/14 | For Rent | $1,075 | +10.3% | -- |
| 03/11/2013 03/11/13 | Rented | $975 | 0.0% | -- |
| 02/19/2013 02/19/13 | Under Contract | -- | -- | -- |
| 02/15/2013 02/15/13 | For Rent | $975 | -- | -- |
| Year | Tax Paid | Tax Assessment Tax Assessment Total Assessment is a certain percentage of the fair market value that is determined by local assessors to be the total taxable value of land and additions on the property. | Land | Improvement |
|---|---|---|---|---|
| 2025 | $1,155 | $11,702 | -- | -- |
| 2024 | $1,158 | $11,145 | -- | -- |
| 2023 | $1,158 | $26,670 | $5,330 | $21,340 |
| 2022 | $1,134 | $21,130 | $4,220 | $16,910 |
| 2021 | $1,148 | $18,650 | $3,730 | $14,920 |
| 2020 | $1,133 | $17,760 | $3,550 | $14,210 |
| 2019 | $1,058 | $15,620 | $3,120 | $12,500 |
| 2018 | $1,016 | $13,850 | $2,770 | $11,080 |
| 2017 | $986 | $13,130 | $2,620 | $10,510 |
| 2016 | $967 | $12,070 | $2,410 | $9,660 |
| 2015 | $909 | $11,130 | $2,220 | $8,910 |
M
Landlord's Agent in 2014
Malarie Johnson
Ih Sfr Pm LLC
(480) 499-3800

Tenant's Agent in 2014
Aaron Ginn-Forsberg
Real Broker
(602) 316-0773
31 Total Sales
Seller's Agent in 2013
Eduardo Enriquez
Barrett Real Estate
(602) 327-2843
25 Total Sales
M
Buyer's Agent in 2013
Michael Ayoub
Roam Home Brokerage Inc.
(512) 825-4758
1 Total Sale
T
Buyer's Agent in 2013
Thomas Stout
Keller Williams Integrity First
Source: Arizona Regional Multiple Listing Service (ARMLS)
MLS Number: 5099199
APN: 138-06-019
Disclaimer: Certain information contained herein is derived from information provided by parties other than Homes.com. All information provided is deemed reliable, but is not guaranteed to be accurate and should be independently verified.
![]() All information should be verified by the recipient and none is guaranteed as accurate by ARMLS
All information should be verified by the recipient and none is guaranteed as accurate by ARMLS
Listing Information presented by local MLS brokerage: Ten-X, local REALTOR®- Arlene Richardson - (888)-952-6393
Ask me questions while you tour the home.