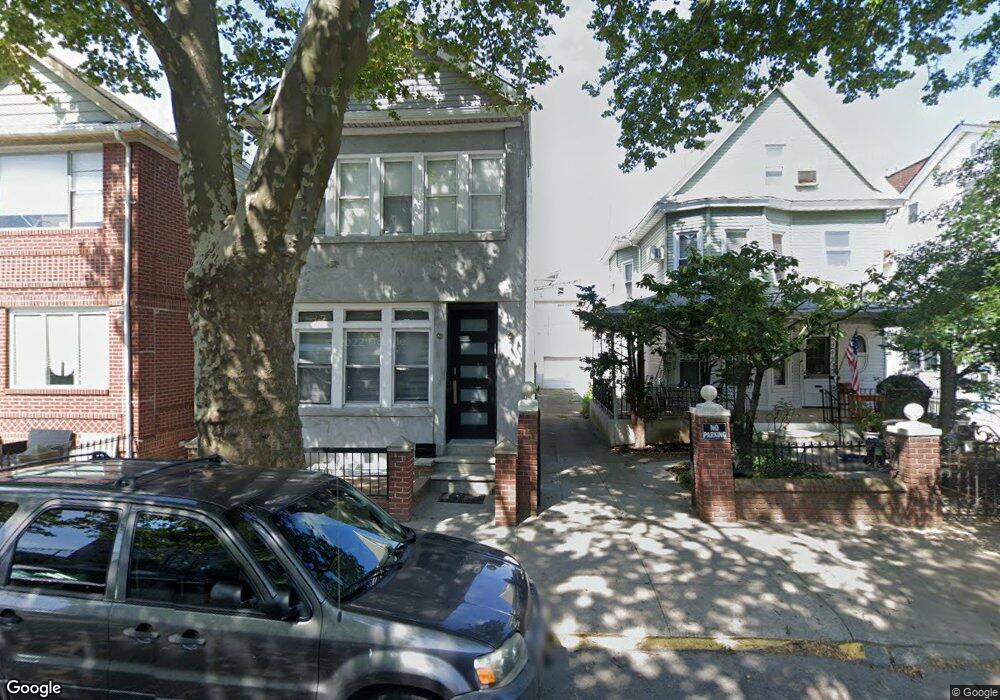
1448 E 5 St Brooklyn, NY 11230
Midwood NeighborhoodEstimated Value: $1,488,000 - $2,011,000
5
Beds
2
Baths
1,984
Sq Ft
$886/Sq Ft
Est. Value
About This Home
This home is located at 1448 E 5 St, Brooklyn, NY 11230 and is currently estimated at $1,758,722, approximately $886 per square foot. 1448 E 5 St is a home located in Kings County with nearby schools including P.S. 226 Alfred De B. Mason, James Madison High School, and Yeshiva Of Brooklyn Girls Div.
Ownership History
Date
Name
Owned For
Owner Type
Purchase Details
Closed on
Nov 6, 2019
Sold by
Cayambe Angel and Santacruz Jose M
Bought by
Esses David and Shemueli Adina
Current Estimated Value
Home Financials for this Owner
Home Financials are based on the most recent Mortgage that was taken out on this home.
Original Mortgage
$705,000
Outstanding Balance
$618,158
Interest Rate
3.65%
Mortgage Type
New Conventional
Estimated Equity
$1,140,564
Purchase Details
Closed on
Feb 27, 2007
Sold by
Cummings Carol A and Wasson Marguerite A
Bought by
Cayambe Angel and Santacruz Jose M
Home Financials for this Owner
Home Financials are based on the most recent Mortgage that was taken out on this home.
Original Mortgage
$99,000
Interest Rate
6.4%
Purchase Details
Closed on
Jun 27, 2005
Sold by
Marguerite A Wasson Exec
Bought by
Cummings Carol A and Wasson Marguerite A
Purchase Details
Closed on
May 14, 2001
Sold by
Albanese Marie A
Bought by
Albanese John M and Wasson Marguerite A
Create a Home Valuation Report for This Property
The Home Valuation Report is an in-depth analysis detailing your home's value as well as a comparison with similar homes in the area
Home Values in the Area
Average Home Value in this Area
Purchase History
| Date | Buyer | Sale Price | Title Company |
|---|---|---|---|
| Esses David | $1,100,000 | -- | |
| Esses David | $1,100,000 | -- | |
| Esses David | $1,100,000 | -- | |
| Cayambe Angel | $660,000 | -- | |
| Cayambe Angel | $660,000 | -- | |
| Cummings Carol A | -- | -- | |
| Cummings Carol A | -- | -- | |
| Albanese John M | -- | -- | |
| Albanese John M | -- | -- |
Source: Public Records
Mortgage History
| Date | Status | Borrower | Loan Amount |
|---|---|---|---|
| Open | Esses David | $705,000 | |
| Closed | Esses David | $705,000 | |
| Previous Owner | Cayambe Angel | $99,000 | |
| Previous Owner | Cayambe Angel | $528,000 |
Source: Public Records
Tax History
| Year | Tax Paid | Tax Assessment Tax Assessment Total Assessment is a certain percentage of the fair market value that is determined by local assessors to be the total taxable value of land and additions on the property. | Land | Improvement |
|---|---|---|---|---|
| 2025 | $9,595 | $91,440 | $21,900 | $69,540 |
| 2024 | $9,595 | $107,580 | $21,900 | $85,680 |
| 2023 | $9,427 | $94,800 | $21,900 | $72,900 |
| 2022 | $8,742 | $90,120 | $21,900 | $68,220 |
| 2021 | $8,881 | $74,580 | $21,900 | $52,680 |
| 2020 | $4,165 | $60,540 | $21,900 | $38,640 |
| 2019 | $8,328 | $60,540 | $21,900 | $38,640 |
| 2018 | $7,886 | $38,683 | $16,829 | $21,854 |
| 2017 | $7,439 | $36,494 | $16,506 | $19,988 |
| 2016 | $7,030 | $35,167 | $14,390 | $20,777 |
| 2015 | $4,152 | $33,177 | $17,181 | $15,996 |
| 2014 | $4,152 | $33,177 | $20,628 | $12,549 |
Source: Public Records
Map
Nearby Homes
- 1350 Ocean Pkwy Unit 3F
- 1360 Ocean Pkwy Unit 6J
- 1360 Ocean Pkwy Unit 3A
- 1463 E 4th St
- 1460 E 4th St
- 1441 3rd Ave Unit 14A
- 1378 E 5th St
- 1463 E 3rd St
- 303 Avenue N
- 301 Avenue N
- 1250 Ocean Pkwy Unit 6R
- 1250 Ocean Pkwy Unit 6A
- 1350 E 5th St Unit 6L
- 1350 E 5th St Unit 1H
- 1350 E 5th St Unit 5I
- 1500 Ocean Pkwy Unit 4G
- 1500 Ocean Pkwy Unit 4M
- 1180 Ocean Pkwy Unit 3E
- 1180 Ocean Pkwy Unit 4 E
- 1171 Ocean Pkwy Unit 2B
Your Personal Tour Guide
Ask me questions while you tour the home.